the graph below shows the value of ednas profits f(t), in dollars, after t months:\nwhat is the closest…
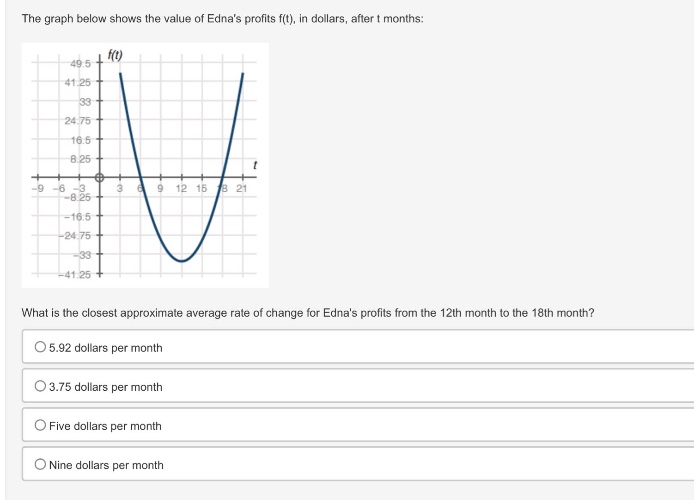
the graph below shows the value of ednas profits f(t), in dollars, after t months:\nwhat is the closest approximate average rate of change for ednas profits from the 12th month to the 18th month?\n5.92 dollars per month\n3.75 dollars per month\nfive dollars per month\nnine dollars per month
Answer
Explanation:
Step1: Recall average - rate - of - change formula
The average rate of change of a function $y = f(t)$ from $t = a$ to $t = b$ is given by $\frac{f(b)-f(a)}{b - a}$. Here, $a = 12$, $b = 18$.
Step2: Estimate function values from the graph
From the graph, when $t = 12$, $f(12)\approx - 33$ (by looking at the $y$-value corresponding to $t = 12$ on the $t - f(t)$ graph). When $t = 18$, $f(18)\approx 18$ (by looking at the $y$-value corresponding to $t = 18$ on the graph).
Step3: Calculate the average rate of change
Substitute into the formula: $\frac{f(18)-f(12)}{18 - 12}=\frac{18-(-33)}{6}=\frac{18 + 33}{6}=\frac{51}{6}=8.5$. The closest value to $8.5$ among the options is 9 dollars per month.
Answer:
Nine dollars per month