the monthly quantity demanded for cars is shown in the table below.\ndemand for cars\nprice (dollars) |…
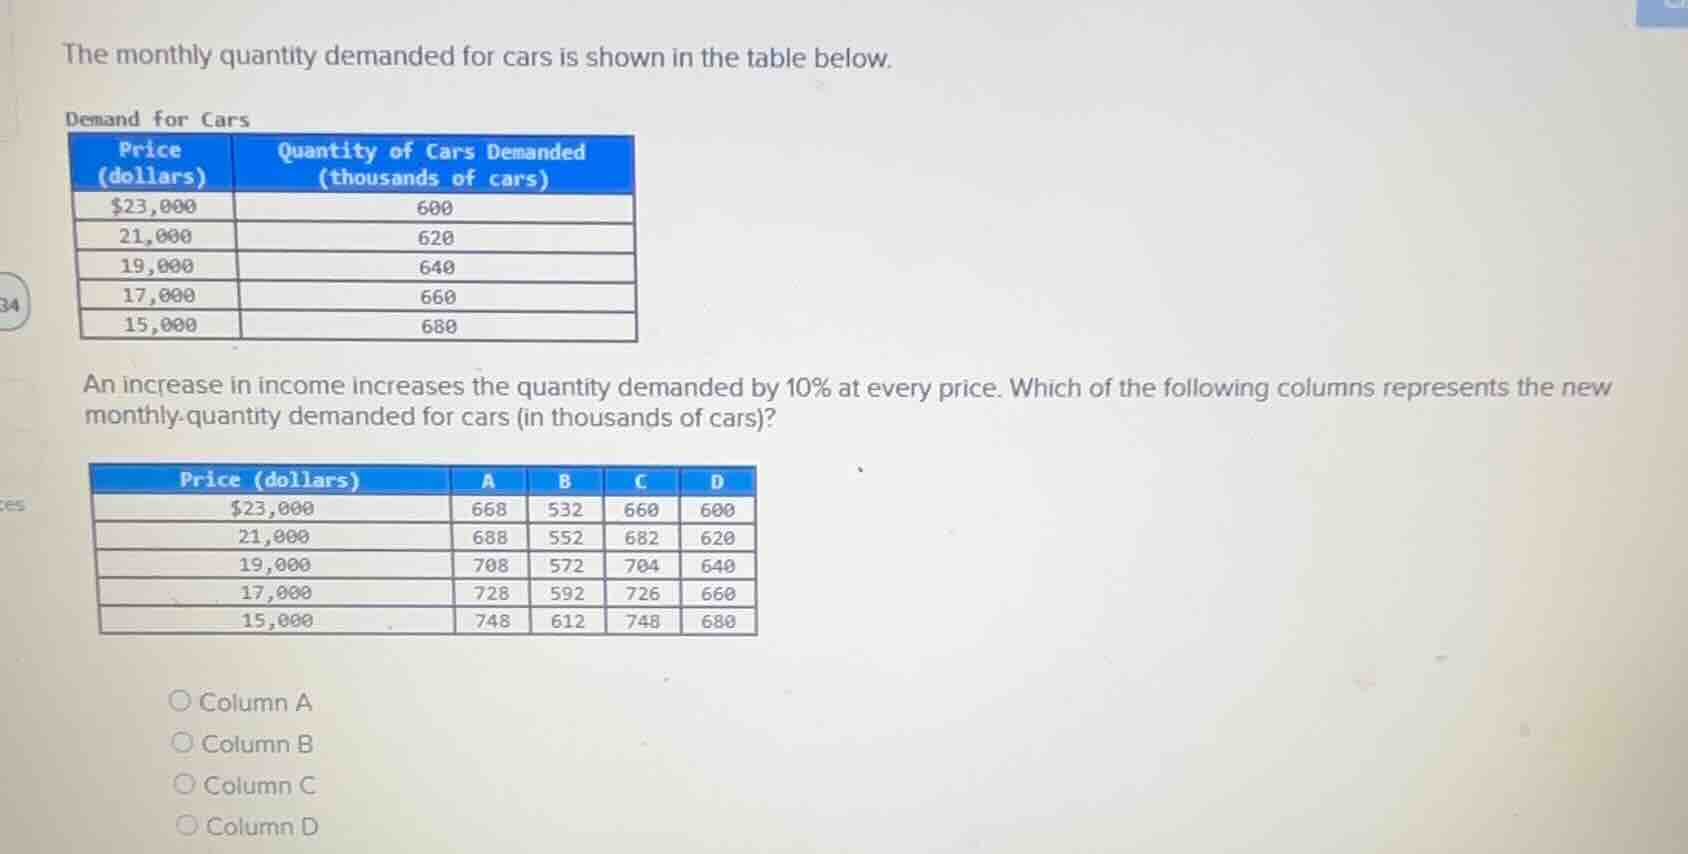
the monthly quantity demanded for cars is shown in the table below.\ndemand for cars\nprice (dollars) | quantity of cars demanded (thousands of cars)\n$23,000 | 600\n21,000 | 620\n19,000 | 640\n17,000 | 660\n15,000 | 680\n\nan increase in income increases the quantity demanded by 10% at every price. which of the following columns represents the new monthly quantity demanded for cars (in thousands of cars)?\n\nprice (dollars) | a | b | c | d\n$23,000 | 668 | 532 | 660 | 600\n21,000 | 688 | 552 | 682 | 620\n19,000 | 708 | 572 | 704 | 640\n17,000 | 728 | 592 | 726 | 660\n15,000 | 748 | 612 | 748 | 680\n\n○ column a\n○ column b\n○ column c\n○ column d
Answer
Explanation:
Step1: Define 10% increase formula
New Quantity = Original Quantity $\times 1.10$
Step2: Calculate for $23,000 price
$600 \times 1.10 = 660$
Step3: Calculate for $21,000 price
$620 \times 1.10 = 682$
Step4: Calculate for $19,000 price
$640 \times 1.10 = 704$
Step5: Calculate for $17,000 price
$660 \times 1.10 = 726$
Step6: Calculate for $15,000 price
$680 \times 1.10 = 748$
Answer:
Column C