suppose the figure represents a local cattle market.\nwhat would be the effect on this market of the local…
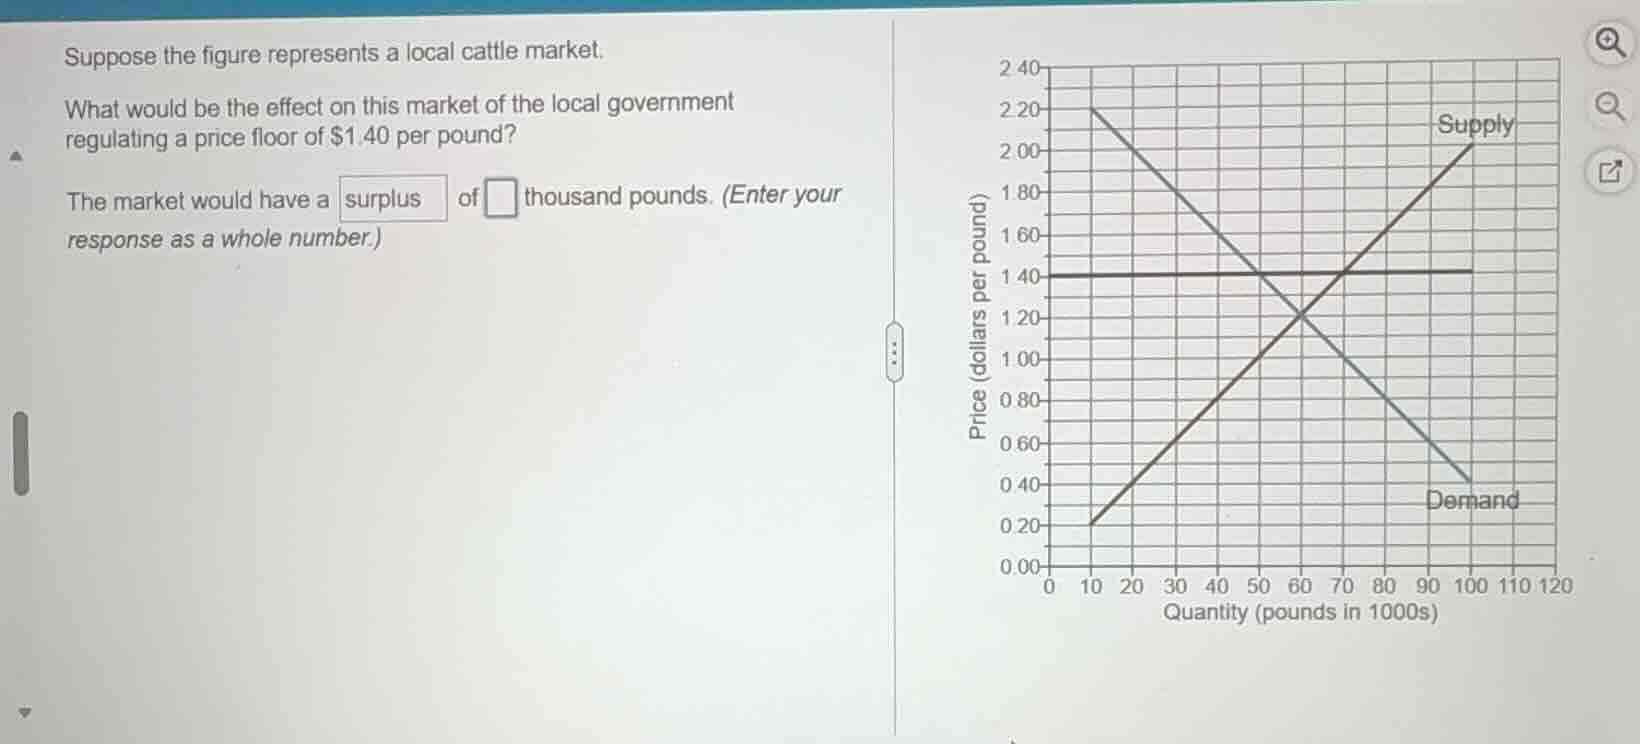
suppose the figure represents a local cattle market.\nwhat would be the effect on this market of the local government regulating a price floor of $1.40 per pound?\nthe market would have a surplus of □ thousand pounds. (enter your response as a whole number.)
Answer
Explanation:
Step1: Find Qd at $1.40
From the graph, at $P = 1.40$, quantity demanded $Q_d = 50$ thousand pounds.
Step2: Find Qs at $1.40$
From the graph, at $P = 1.40$, quantity supplied $Q_s = 80$ thousand pounds.
Step3: Calculate surplus
Surplus = $Q_s - Q_d$ $\text{Surplus} = 80 - 50$
Answer:
30