tony opens a savings account. the graph represents the amount of money in dollars that tony expects to…
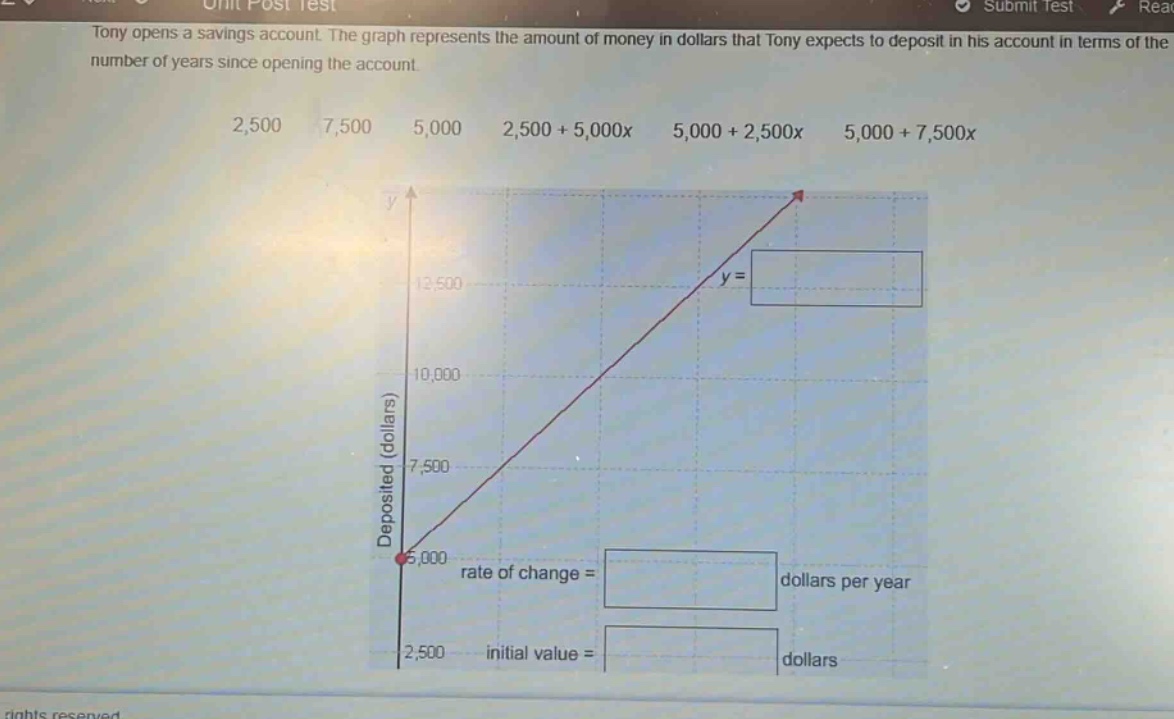
tony opens a savings account. the graph represents the amount of money in dollars that tony expects to deposit in his account in terms of the number of years since opening the account. 2,500 7,500 5,000 2,500 + 5,000x 5,000 + 2,500x 5,000 + 7,500x deposited (dollars) rate of change = dollars per year initial value = dollars
Answer
Explanation:
Step1: Identify the initial - value
The initial value is the amount of money in the account when (x = 0) (the moment the account is opened). Looking at the graph, when (x=0), (y = 5000). So the initial value is (5000) dollars.
Step2: Calculate the rate - of - change
The rate of change (slope) of a linear function (y=mx + b) can be found using two points ((x_1,y_1)) and ((x_2,y_2)) on the line. Let's take two points: ((0,5000)) and ((1,7500)). The formula for the slope (m=\frac{y_2 - y_1}{x_2 - x_1}). Here, (x_1 = 0,y_1=5000,x_2 = 1,y_2 = 7500). Then (m=\frac{7500 - 5000}{1-0}=2500) dollars per year.
Step3: Write the linear equation
The slope - intercept form of a linear equation is (y=mx + b), where (m) is the slope and (b) is the (y) - intercept. We know (m = 2500) and (b = 5000), so the equation is (y=2500x + 5000).
Answer:
(y=2500x + 5000) rate of change (= 2500) initial value (= 5000)