use the graph shown to answer the question. growth curve a represents $200 saved at 2.5 percent simple…
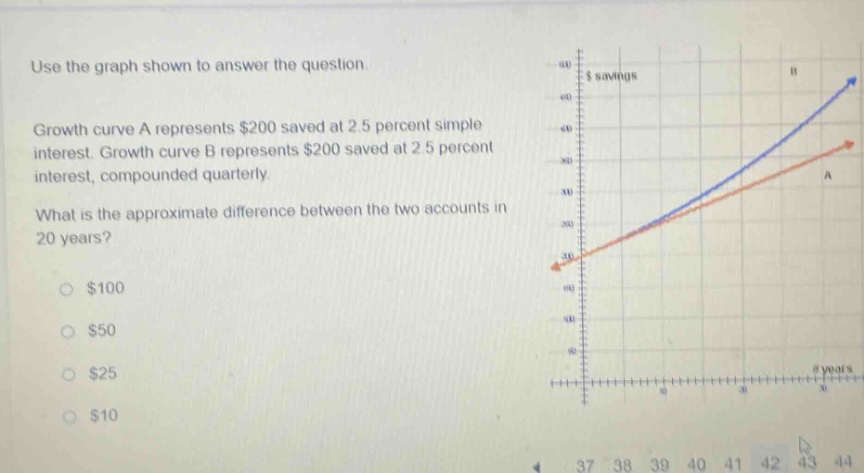
use the graph shown to answer the question. growth curve a represents $200 saved at 2.5 percent simple interest. growth curve b represents $200 saved at 2.5 percent interest, compounded quarterly. what is the approximate difference between the two accounts in 20 years? $100 $50 $25 $10
Answer
Explanation:
Step1: Calculate simple - interest amount
The simple - interest formula is $A = P(1+rt)$, where $P=$200$, $r = 0.025$ (2.5% as a decimal), and $t = 20$ years. $A_{s}=200(1 + 0.025\times20)=200(1 + 0.5)=200\times1.5=$300$
Step2: Calculate compound - interest amount
The compound - interest formula is $A = P(1+\frac{r}{n})^{nt}$, where $P = 200$, $r=0.025$, $n = 4$ (compounded quarterly), and $t = 20$ years. $A_{c}=200(1+\frac{0.025}{4})^{4\times20}=200(1 + 0.00625)^{80}$. Let $x=(1 + 0.00625)^{80}$. Using the formula $(a + b)^n=\sum_{k = 0}^{n}\binom{n}{k}a^{n - k}b^{k}$, or simply using a calculator, $x\approx1.640605$. So $A_{c}=200\times1.640605=$328.121$.
Step3: Calculate the difference
$D=A_{c}-A_{s}=328.121 - 300=$28.121\approx$25$.
Answer:
$25$