analyze the graph of the function f(x) to complete the statement. f(x)<0 over (-∞, -3) and what other…
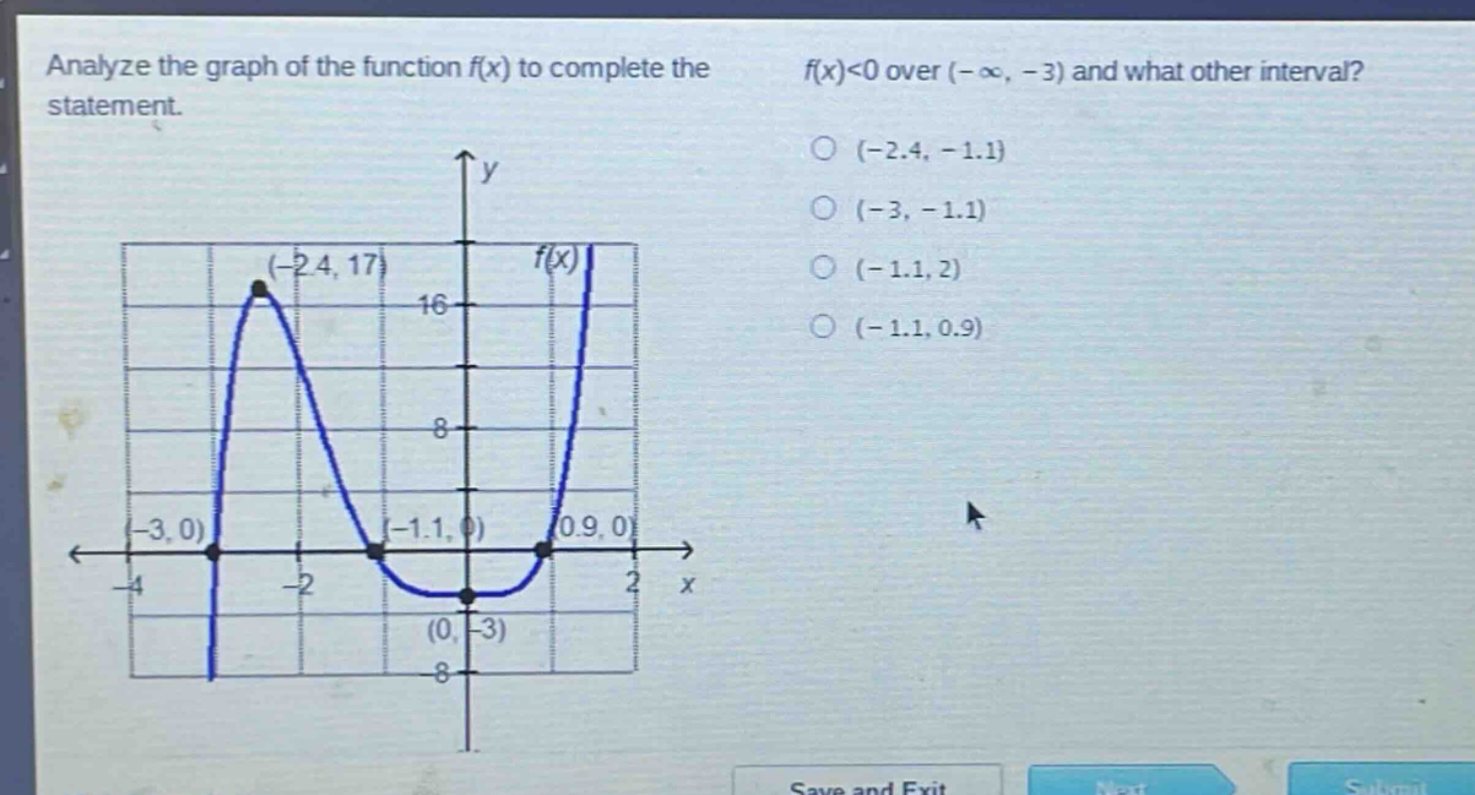
analyze the graph of the function f(x) to complete the statement. f(x)<0 over (-∞, -3) and what other interval? (-2.4, -1.1) (-3, -1.1) (-1.1, 2) (-1.1, 0.9)
Answer
Explanation:
Step1: Understand function - value condition
We want to find where (f(x)<0). This means we need to identify the intervals on the (x -)axis where the graph of the function (y = f(x)) is below the (x -)axis.
Step2: Analyze the graph
The graph of (y = f(x)) intersects the (x -)axis at (x=-3), (x = - 1.1), and (x=0.9). The graph is below the (x -)axis for (x\in(-\infty,-3)) and (x\in(-1.1,0.9)).
Answer:
D. ((-1.1,0.9))