an arrangement for one container needs to have at least 4 flowers in it and the total wholesale cost must be…
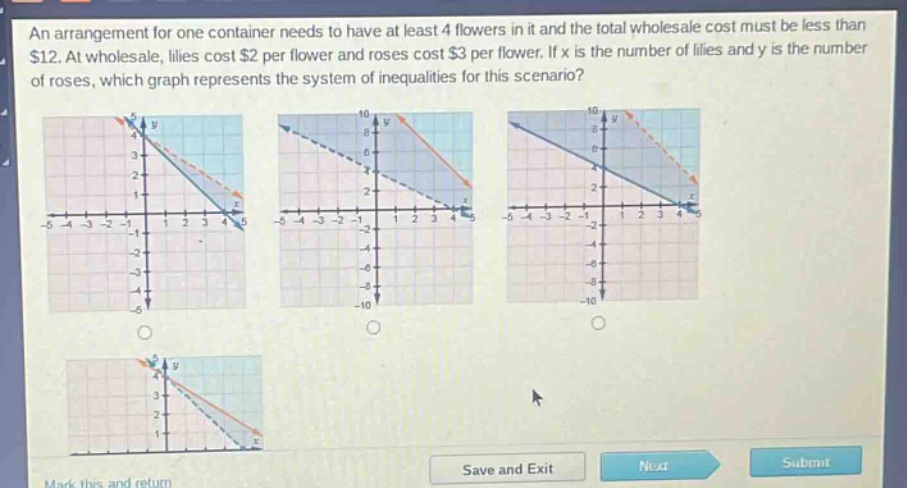
an arrangement for one container needs to have at least 4 flowers in it and the total wholesale cost must be less than $12. at wholesale, lilies cost $2 per flower and roses cost $3 per flower. if x is the number of lilies and y is the number of roses, which graph represents the system of inequalities for this scenario?
Answer
Explanation:
Step1: Set - up the first inequality
The arrangement must have at least 4 flowers. So, the sum of lilies ($x$) and roses ($y$) gives the inequality $x + y\geq4$. In slope - intercept form $y\geq - x + 4$. The boundary line $y=-x + 4$ has a y - intercept of 4 and a slope of - 1. Since the inequality is $\geq$, the boundary line is solid.
Step2: Set - up the second inequality
Lilies cost $2 per flower and roses cost $3 per flower, and the total cost must be less than $12. So, $2x+3y\lt12$. In slope - intercept form, we solve for $y$: $3y\lt - 2x + 12$, then $y\lt-\frac{2}{3}x + 4$. The boundary line $y =-\frac{2}{3}x+4$ has a y - intercept of 4 and a slope of $-\frac{2}{3}$. Since the inequality is $\lt$, the boundary line is dashed.
Step3: Analyze the region
We also have the non - negativity constraints $x\geq0$ and $y\geq0$ since the number of flowers cannot be negative. The region that satisfies $x + y\geq4$ is above the line $y=-x + 4$ (including the line), and the region that satisfies $2x + 3y\lt12$ is below the line $y=-\frac{2}{3}x + 4$ (not including the line).
Answer:
The graph that has a solid line $y=-x + 4$ and a dashed line $y=-\frac{2}{3}x + 4$, with the region that is above $y=-x + 4$ and below $y=-\frac{2}{3}x + 4$ (in the first quadrant since $x\geq0$ and $y\geq0$) is the correct one. Without specific labels on the given graphs, the description above can be used to identify the correct graph among the options.