a balloon artist creates balloon hats for children at a stores grand opening. the graph shows the number of…
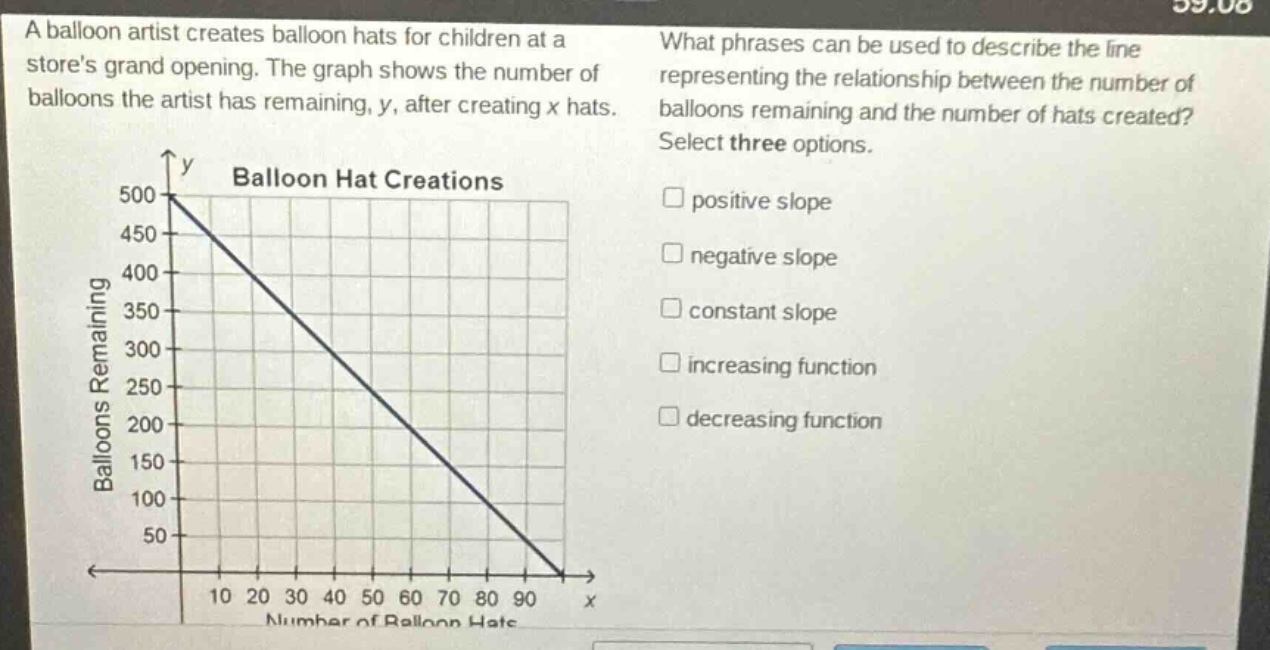
a balloon artist creates balloon hats for children at a stores grand opening. the graph shows the number of balloons the artist has remaining, y, after creating x hats. what phrases can be used to describe the line representing the relationship between the number of balloons remaining and the number of hats created? select three options. positive slope negative slope constant slope increasing function decreasing function
Answer
Answer:
B. negative slope, C. constant slope, E. decreasing function
Explanation:
Step1: Analyze slope direction
As the number of hats $x$ increases, the number of balloons remaining $y$ decreases. So the slope is negative.
Step2: Check slope constancy
The graph is a straight - line. For a straight - line graph, the slope between any two points is the same, so it has a constant slope.
Step3: Determine function type
Since the value of $y$ (number of balloons remaining) decreases as the value of $x$ (number of hats created) increases, it is a decreasing function.