bernie is practicing the 100 - meter dash on the straight portion of his schools track. he sprints 100…
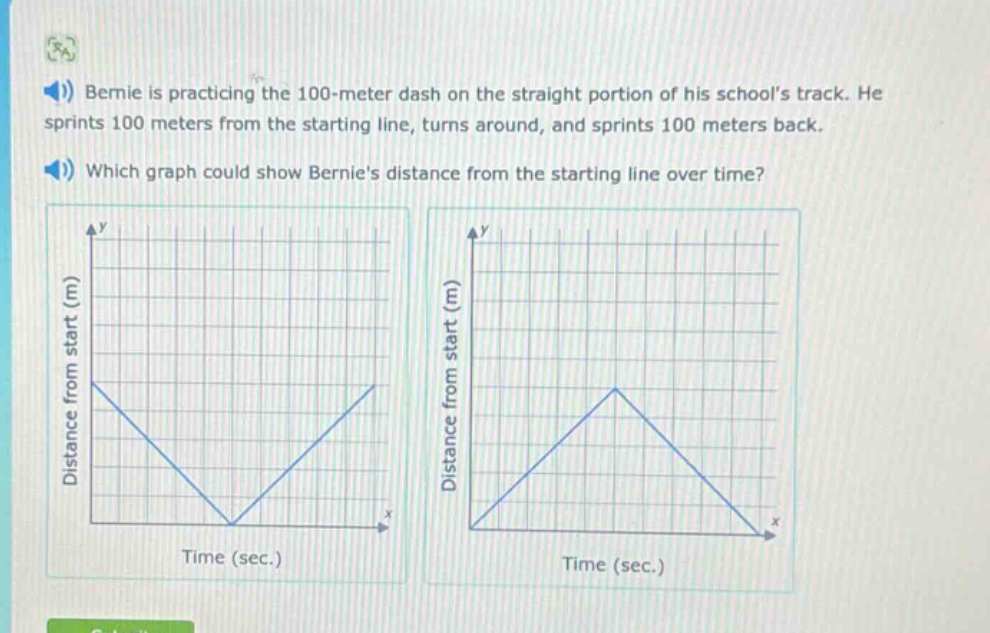
bernie is practicing the 100 - meter dash on the straight portion of his schools track. he sprints 100 meters from the starting line, turns around, and sprints 100 meters back. which graph could show bernies distance from the starting line over time?
Answer
Explanation:
Step1: Analizar el primer tramo
Al principio, Bernie sale de la línea de salida y corre 100 metros hacia adelante. Entonces, la distancia desde la línea de salida aumenta con el tiempo.
Step2: Analizar el segundo tramo
Luego, gira y corre 100 metros hacia atrás. Entonces, la distancia desde la línea de salida disminuye con el tiempo.
Answer:
La gráfica de la derecha es la correcta, ya que muestra que la distancia desde la línea de salida aumenta en el primer tramo y luego disminuye en el segundo tramo.