brennan is playing megalopolis madness, a video game where you expand and improve your own city. his city…
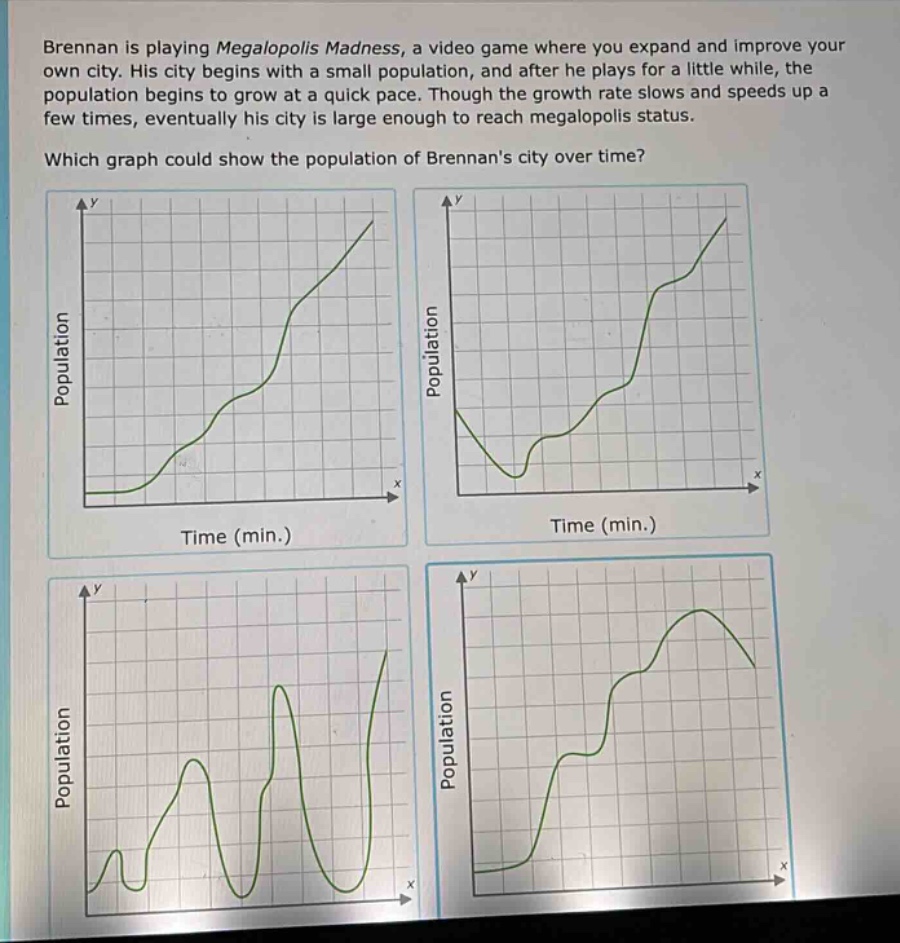
brennan is playing megalopolis madness, a video game where you expand and improve your own city. his city begins with a small population, and after he plays for a little while, the population begins to grow at a quick pace. though the growth rate slows and speeds up a few times, eventually his city is large enough to reach megalopolis status. which graph could show the population of brennans city over time?
Answer
Answer:
The first graph (top - left)
Explanation:
Step1: Analyze the population start
The city starts with a small population, so the graph should start at a non - zero low value on the population axis.
Step2: Consider the growth pattern
The population grows at a quick pace initially, then the growth rate slows and speeds up a few times, and eventually reaches megalopolis status. The first graph shows a smooth initial increase, followed by fluctuations in the growth rate and a continued overall upward trend which matches the description. The second graph starts with a decrease which is not correct as the population starts growing. The third graph has extreme fluctuations and dips which are not in line with the description. The fourth graph has a decline at the end which is not consistent with reaching megalopolis status.