bryans best friend lives a few floors below him in the same apartment building. after school, they go…
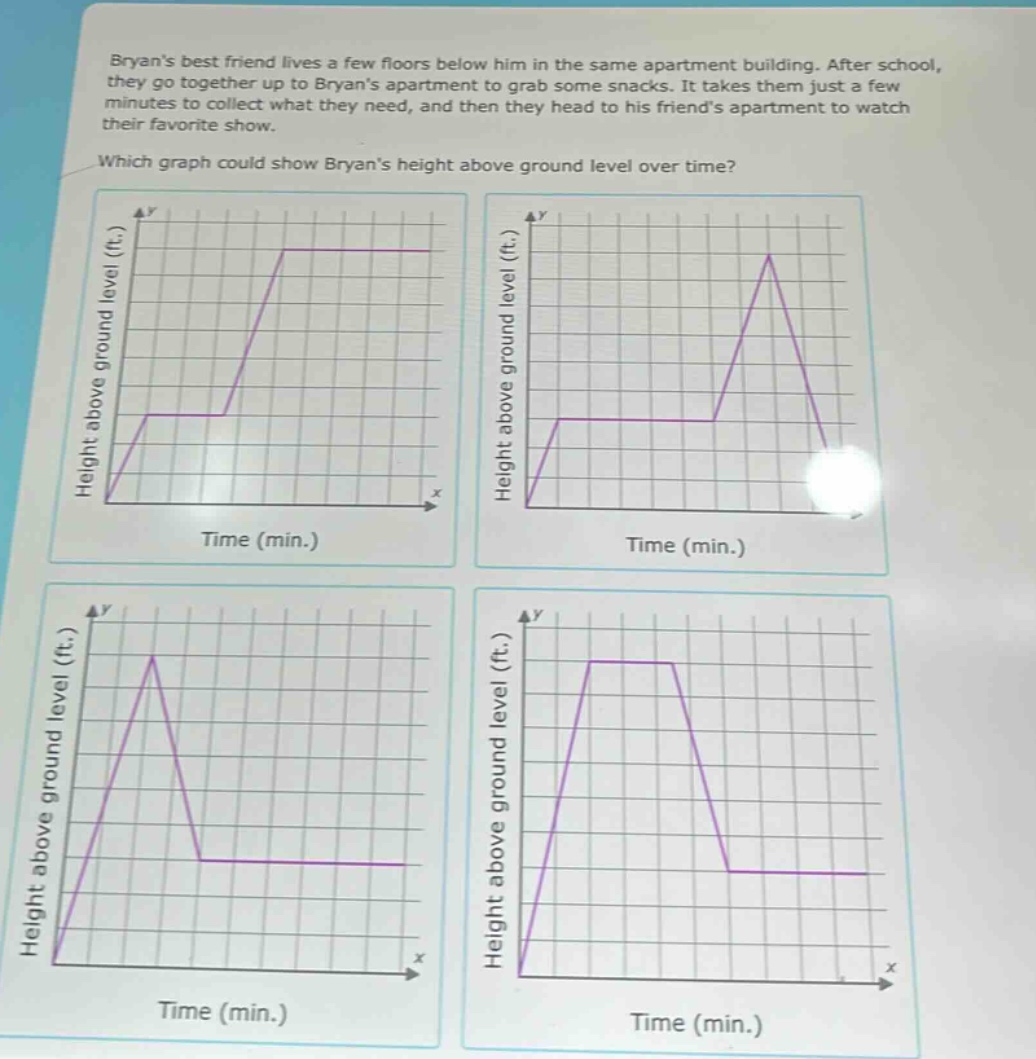
bryans best friend lives a few floors below him in the same apartment building. after school, they go together up to bryans apartment to grab some snacks. it takes them just a few minutes to collect what they need, and then they head to his friends apartment to watch their favorite show. which graph could show bryans height above ground level over time?
Answer
Explanation:
Step1: Analyze initial movement
Bryan and his friend first go up to Bryan's apartment. So the height - above - ground level (y - axis) should increase as time (x - axis) passes.
Step2: Analyze time at Bryan's apartment
They spend some time collecting snacks at Bryan's apartment. During this time, the height above ground level remains constant, so the graph should have a horizontal segment.
Step3: Analyze movement to friend's apartment
Then they head to his friend's apartment which is below. So the height above ground level should decrease as time passes.
Answer:
The second graph (top - right) is the correct one as it first shows an increase in height, then a horizontal segment for the time spent at Bryan's apartment, and then a decrease in height.