a car increases, then decreases, its speed. which table could represent the speed of the car?\ntime (min) 5…
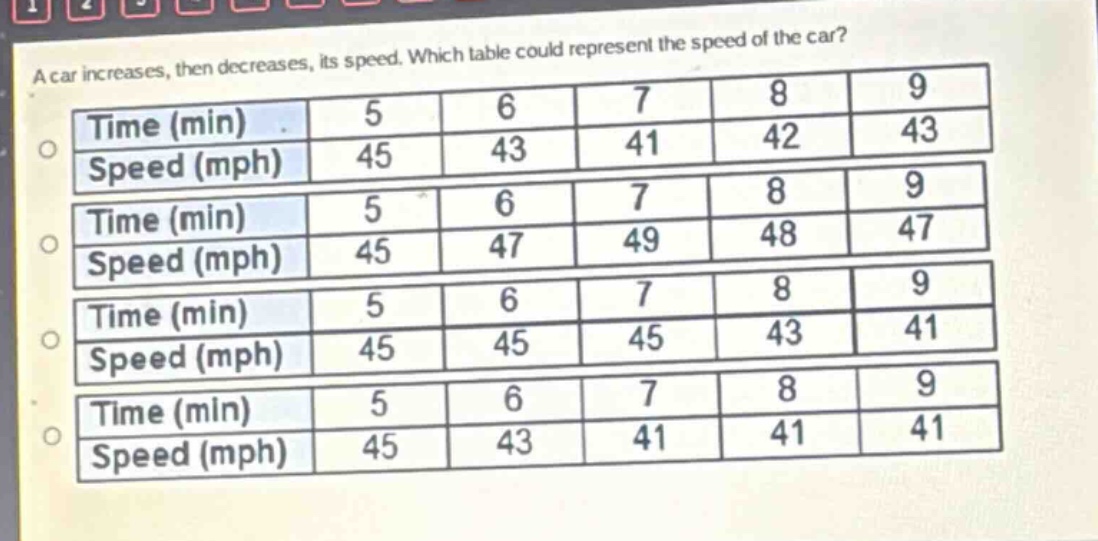
a car increases, then decreases, its speed. which table could represent the speed of the car?\ntime (min) 5 6 7 8 9\nspeed (mph) 45 43 41 42 43\ntime (min) 5 6 7 8 9\nspeed (mph) 45 47 49 48 47\ntime (min) 5 6 7 8 9\nspeed (mph) 45 45 45 43 41\ntime (min) 5 6 7 8 9\nspeed (mph) 45 43 41 41 41
Answer
Answer:
Second table (Time: 5, 6, 7, 8, 9; Speed: 45, 47, 49, 48, 47)
Explanation:
Step1: Analyze first table
Speed decreases from 45 to 43 to 41, then increases slightly to 42 and 43. But it starts decreasing right away.
Step2: Analyze second table
Speed starts at 45, increases to 47 at 6 minutes and 49 at 7 minutes, then decreases to 48 at 8 minutes and 47 at 9 minutes, which meets the criteria of increasing then decreasing.
Step3: Analyze third table
Speed stays at 45 for 5 - 6 - 7 minutes then decreases, no initial increase.
Step4: Analyze fourth table
Speed decreases from 45 to 43 to 41 and stays at 41, no increase.