a career - placement test eliminates a profession when a person receives a score of 18 or less. the score is…
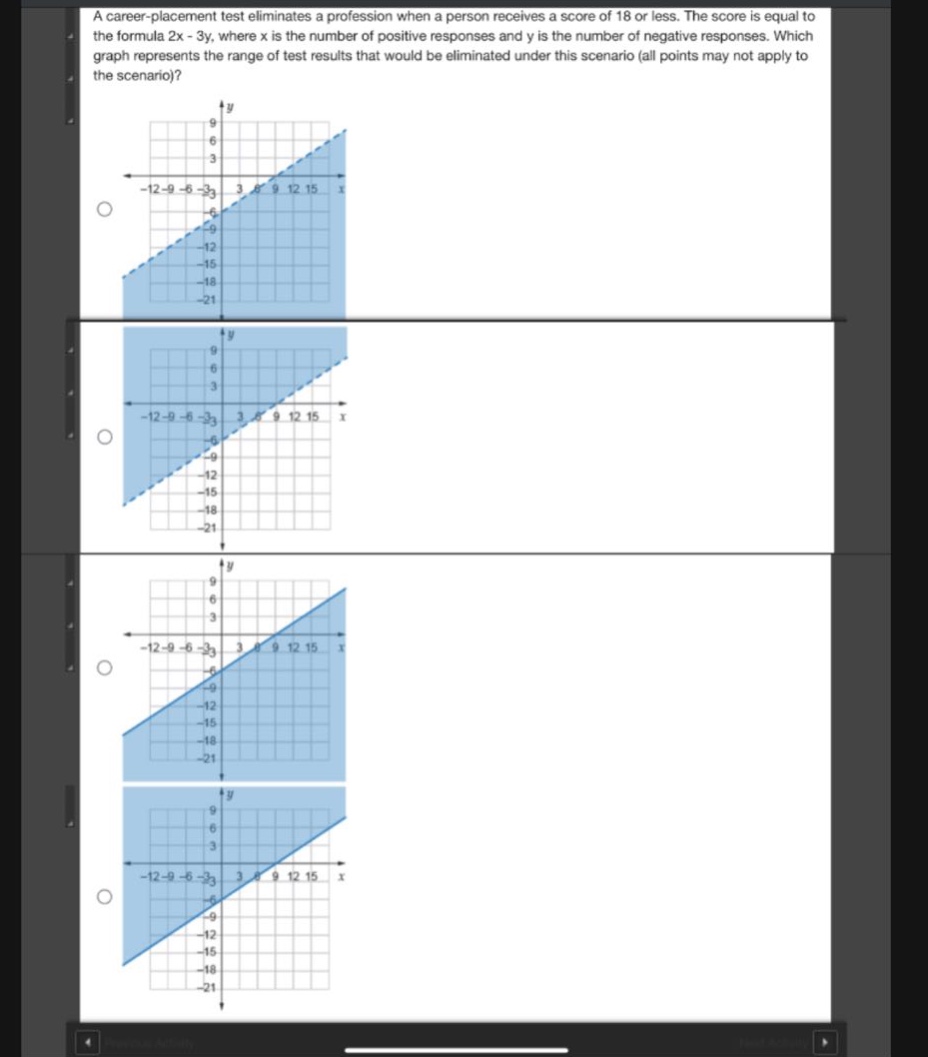
a career - placement test eliminates a profession when a person receives a score of 18 or less. the score is equal to the formula 2x - 3y, where x is the number of positive responses and y is the number of negative responses. which graph represents the range of test results that would be eliminated under this scenario (all points may not apply to the scenario)?
Answer
Explanation:
Step1: Set up the inequality
The score is given by $2x - 3y$, and a profession is eliminated when the score is 18 or less. So we set up the inequality $2x-3y\leq18$.
Step2: Rewrite the inequality in slope - intercept form
Solve $2x - 3y\leq18$ for $y$. First, subtract $2x$ from both sides: $- 3y\leq - 2x + 18$. Then divide by $-3$. When dividing an inequality by a negative number, the direction of the inequality sign changes. So we get $y\geq\frac{2}{3}x - 6$. The boundary line is $y=\frac{2}{3}x - 6$ and the region above this line (since $y$ is greater than or equal to the expression) represents the range of test - results that would not be eliminated. The region below the line $y=\frac{2}{3}x - 6$ (dashed if the inequality was $2x-3y<18$ and solid if it is $2x - 3y\leq18$) represents the range of test results that would be eliminated.
The graph with a solid line $y=\frac{2}{3}x - 6$ and the region below the line is the correct one. Without seeing the specific options clearly labeled, the general approach is to look for a graph with a line having a slope of $\frac{2}{3}$ and a $y$ - intercept of $-6$ and the region below the line shaded.