choosing the graph of the sum of two functions\na moving sidewalk travels at a rate defined by the function…
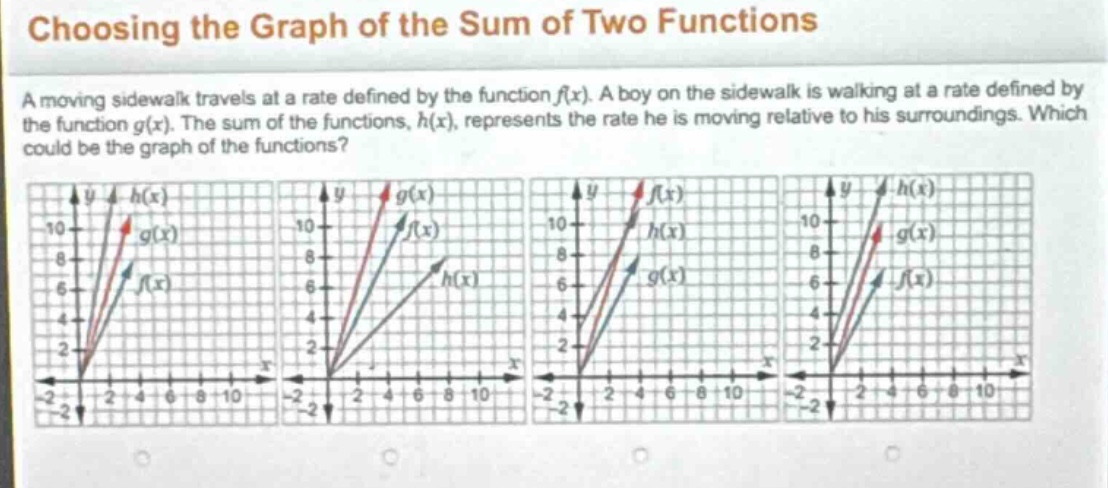
choosing the graph of the sum of two functions\na moving sidewalk travels at a rate defined by the function $f(x)$. a boy on the sidewalk is walking at a rate defined by the function $g(x)$. the sum of the functions, $h(x)$, represents the rate he is moving relative to his surroundings. which could be the graph of the functions?
Answer
Explanation:
Step1: Recall function sum property
For any $x$, $h(x)=f(x)+g(x)$, so $h(x)$ must be greater than both $f(x)$ and $g(x)$ for positive $x$ (since all rates are positive here).
Step2: Analyze each graph
- Graph1: $h(x) > g(x) > f(x)$, fits $h=f+g$.
- Graph2: $h(x) < f(x), g(x)$, violates $h=f+g$.
- Graph3: $f(x) > h(x) > g(x)$, violates $h=f+g$.
- Graph4: $h(x) > g(x) > f(x)$, but the slope difference does not match additive growth (the gap between $h$ and $g$ should equal $f$'s value, which is only true for the first graph).
Answer:
The first graph (leftmost one, with $h(x)$ as the steepest line above $g(x)$ and $f(x)$)