a city determines that a planned community must have at least 4 acres of developed and open space, and the…
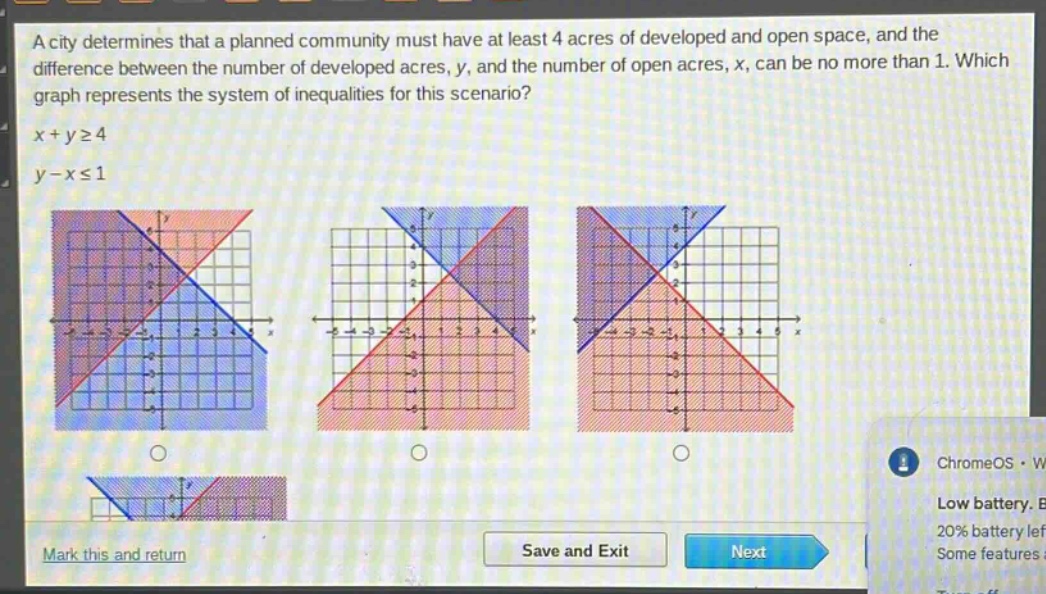
a city determines that a planned community must have at least 4 acres of developed and open space, and the difference between the number of developed acres, y, and the number of open acres, x, can be no more than 1. which graph represents the system of inequalities for this scenario?\nx + y≥4\ny - x≤1
Answer
Explanation:
Step1: Analyze the first inequality $x + y\geq4$
The boundary - line is $x + y=4$. Rewrite it as $y=-x + 4$. The inequality $x + y\geq4$ represents the region above the line $y=-x + 4$ (including the line itself) since for a test - point like $(0,0)$, $0+0=0<4$, so the region that does not contain the origin is the solution region for $x + y\geq4$.
Step2: Analyze the second inequality $y - x\leq1$
The boundary - line is $y - x=1$ or $y=x + 1$. The inequality $y - x\leq1$ represents the region below the line $y=x + 1$ (including the line itself) since for a test - point like $(0,0)$, $0-0 = 0\leq1$, so the region that contains the origin is the solution region for $y - x\leq1$.
Step3: Combine the two regions
The solution of the system of inequalities is the intersection of the regions of the two inequalities.
Answer:
The graph that has the region above the line $y=-x + 4$ and below the line $y=x + 1$ (including the lines themselves) is the correct graph. Without specific labels on the given graphs, we can't identify the exact one by name, but by following the above - described regions, one can pick the correct graph from the options.