a collectors item is purchased for $150 and its value increases by 3% each year. which graph can be used to…
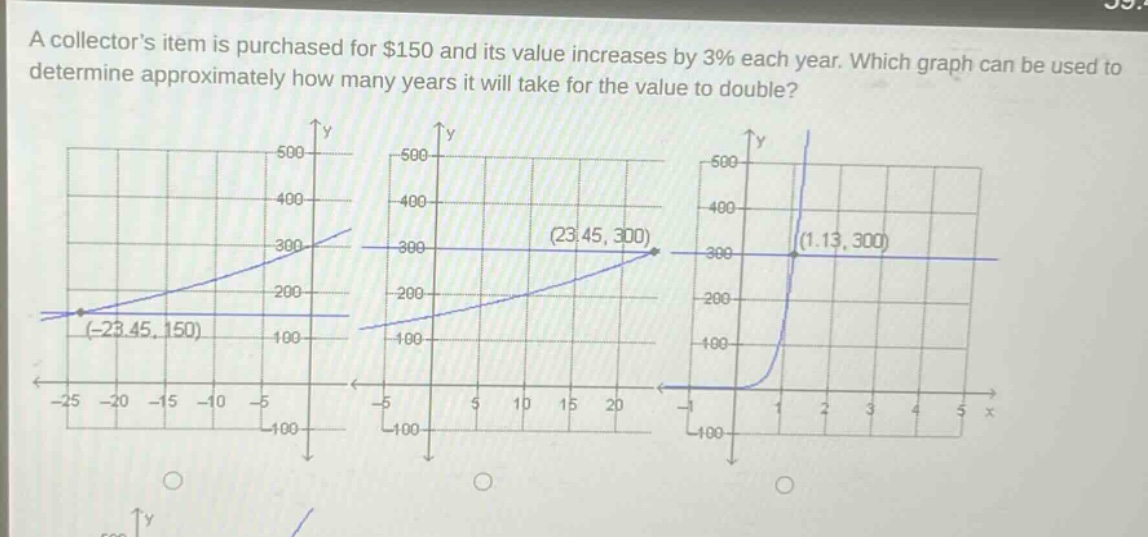
a collectors item is purchased for $150 and its value increases by 3% each year. which graph can be used to determine approximately how many years it will take for the value to double?
Answer
Explanation:
Step1: Write the exponential - growth formula
The formula for exponential growth is $A = P(1 + r)^t$, where $P$ is the initial amount, $r$ is the growth rate as a decimal, and $t$ is the time in years. Here, $P=$150$, $r = 0.03$, and $A$ is the final amount. We want to find the time $t$ when $A = 2P=300$. So the equation becomes $300=150(1 + 0.03)^t$.
Step2: Simplify the equation
Divide both sides of the equation $300 = 150(1 + 0.03)^t$ by 150. We get $\frac{300}{150}=(1.03)^t$, which simplifies to $2=(1.03)^t$.
Step3: Analyze the graph requirements
We are looking for a graph of $y = 150(1.03)^x$ (where $x$ represents years) and we want to find the $x$ - value when $y = 300$. The function $y = 150(1.03)^x$ is an exponential - growth function of the form $y = ab^x$ with $a = 150$ and $b=1.03>1$. The initial value of the function (when $x = 0$) is $y = 150$, and it increases as $x$ increases. We need to find the $x$ - value (number of years) when $y = 300$. The correct graph should show the exponential - growth curve $y = 150(1.03)^x$ and the point where $y = 300$ and the corresponding positive $x$ - value.
The second graph is correct because it shows an exponential - growth function starting at $y = 150$ (when $x = 0$ is not shown in the visible part of the graph but can be inferred) and has the point $(23.45,300)$ which represents the number of years ($x = 23.45$) it takes for the value to reach $300$ (double the initial value of $150$).
Answer:
The second graph.