consider the graph of the quadratic function. which interval on the x - axis has a negative rate of…
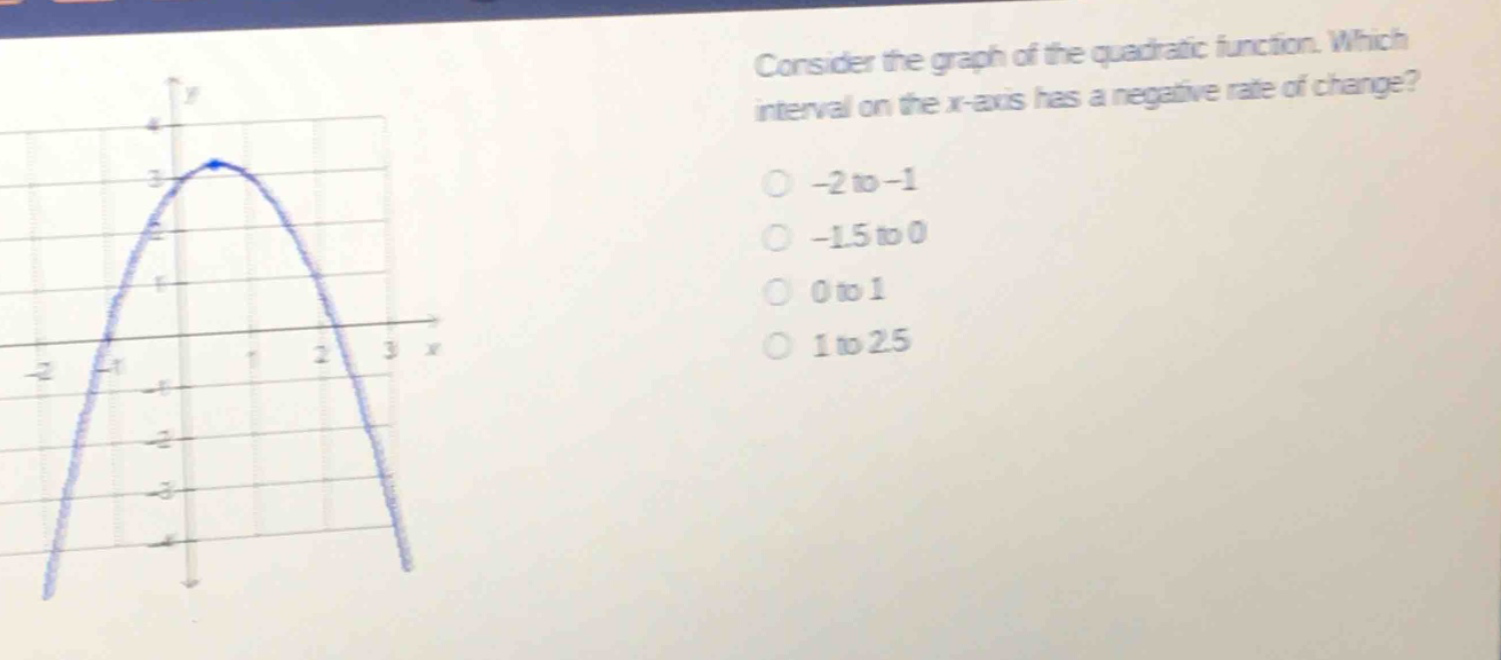
consider the graph of the quadratic function. which interval on the x - axis has a negative rate of change?\n-2 to -1\n-1.5 to 0\n0 to 1\n1 to 2.5
Answer
Explanation:
Step1: Recall rate - of - change concept
The rate of change of a function $y = f(x)$ on the interval $[a,b]$ is $\frac{f(b)-f(a)}{b - a}$. For a quadratic function, the function is decreasing (negative rate of change) when the graph is going down as we move from left to right.
Step2: Analyze each interval
- For the interval $-2$ to $-1$: The graph is going up as we move from $x=-2$ to $x = - 1$, so the rate of change is positive.
- For the interval $-1.5$ to $0$: The graph is going up as we move from $x=-1.5$ to $x = 0$, so the rate of change is positive.
- For the interval $0$ to $1$: The graph is going down as we move from $x = 0$ to $x=1$, so the rate of change $\frac{f(1)-f(0)}{1 - 0}<0$ since $f(1)<f(0)$.
- For the interval $1$ to $2.5$: The graph is going down as we move from $x = 1$ to $x=2.5$, but we are asked for the most appropriate single - interval among the given options and $0$ to $1$ is a more 'basic' decreasing interval shown in the graph.
Answer:
$0$ to $1$