the cost of soup, s, varies directly with the number of cans, c. when c is 4, the cost is $3. which graph…
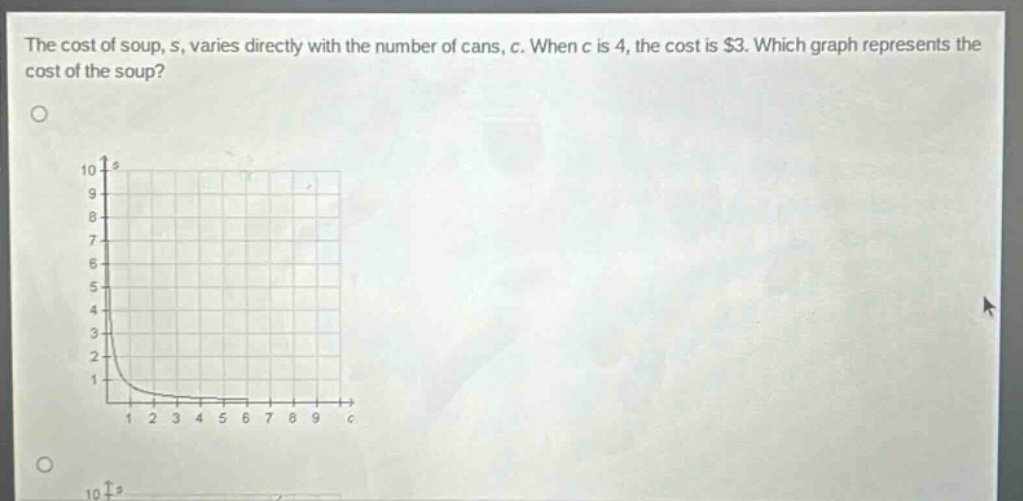
the cost of soup, s, varies directly with the number of cans, c. when c is 4, the cost is $3. which graph represents the cost of the soup?
Answer
Explanation:
Step1: Find the direct - variation equation
Since $s$ varies directly with $c$, the equation is $s = kc$, where $k$ is the constant of variation. Substitute $c = 4$ and $s=3$ into the equation: $3=k\times4$, so $k=\frac{3}{4}$. The equation is $s=\frac{3}{4}c$.
Step2: Analyze the properties of the graph
The equation $s=\frac{3}{4}c$ is a linear equation in the form $y = mx$ (where $y = s$, $x = c$, and $m=\frac{3}{4}$). The graph of a direct - variation equation $y = mx$ is a straight line passing through the origin $(0,0)$ with a positive slope. The slope $m=\frac{3}{4}$ means that for every increase of 1 in $c$, $s$ increases by $\frac{3}{4}$.
The graph that represents the cost of the soup is a straight - line graph passing through the origin with a positive slope.
Since the graphs are not fully shown in your input, but based on the above - derived properties, the correct graph is a straight line passing through the origin $(0,0)$ with a positive slope of $\frac{3}{4}$. If there is a graph among the options that is a straight line passing through the origin and has a positive slope, that is the correct one.
Answer:
The graph that is a straight line passing through the origin $(0,0)$ with a positive slope.