which description of the graph of the linear inequality y > 3x - 8 is correct?\nthe graph will be a dashed…
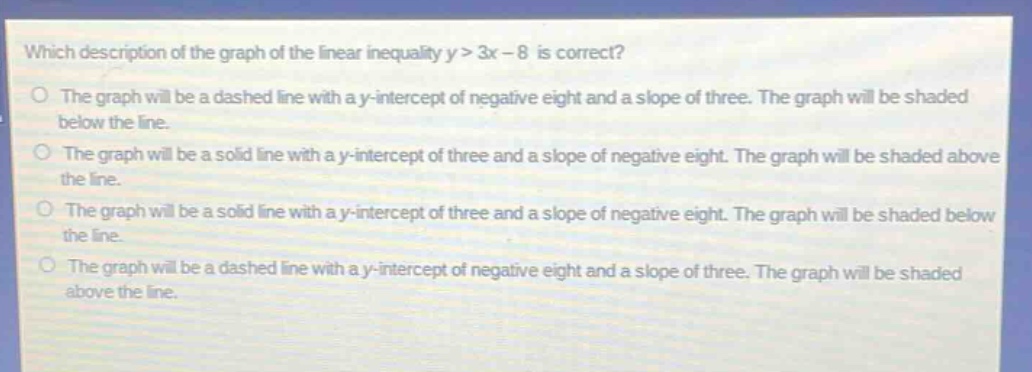
which description of the graph of the linear inequality y > 3x - 8 is correct?\nthe graph will be a dashed line with a y - intercept of negative eight and a slope of three. the graph will be shaded below the line.\nthe graph will be a solid line with a y - intercept of three and a slope of negative eight. the graph will be shaded above the line.\nthe graph will be a solid line with a y - intercept of three and a slope of negative eight. the graph will be shaded below the line.\nthe graph will be a dashed line with a y - intercept of negative eight and a slope of three. the graph will be shaded above the line.
Answer
Explanation:
Step1: Identify line type
For $y>3x - 8$, since it is a strict inequality ($>$), the line is dashed.
Step2: Find slope and y - intercept
The equation of a line is $y=mx + b$, where $m$ is the slope and $b$ is the y - intercept. For $y>3x - 8$, $m = 3$ (slope) and $b=-8$ (y - intercept).
Step3: Determine shading region
For $y>3x - 8$, we shade the region above the line because we want all the points where $y$ values are greater than the $y$ values on the line $y = 3x-8$.
Answer:
The graph will be a dashed line with a y - intercept of negative eight and a slope of three. The graph will be shaded above the line.