which description is represented by a discrete graph?\nkiley bought a platter for $19 and several matching…
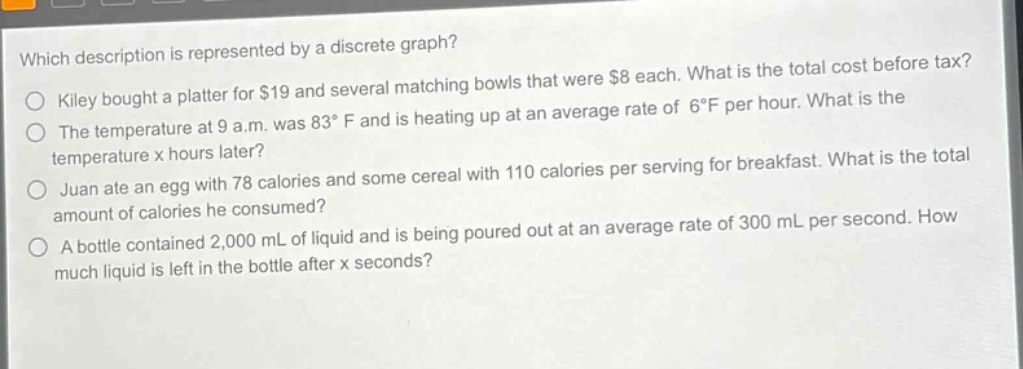
which description is represented by a discrete graph?\nkiley bought a platter for $19 and several matching bowls that were $8 each. what is the total cost before tax?\nthe temperature at 9 a.m. was 83°f and is heating up at an average rate of 6°f per hour. what is the temperature x hours later?\njuan ate an egg with 78 calories and some cereal with 110 calories per serving for breakfast. what is the total amount of calories he consumed?\na bottle contained 2,000 ml of liquid and is being poured out at an average rate of 300 ml per second. how much liquid is left in the bottle after x seconds?
Answer
Brief Explanations:
A discrete graph represents data that can only take on certain distinct values. In the case of Kiley buying a platter and bowls, the number of bowls can only be a whole - number (0, 1, 2, etc.). For the temperature, calorie, and liquid - pouring scenarios, the variables (time in hours or seconds) can take on any real - valued number within a range, leading to continuous graphs.
Answer:
Kiley bought a platter for $19 and several matching bowls that were $8 each. What is the total cost before tax?