determining a graph from a description\njuan spent 10 minutes on his history homework and 3 minutes per…
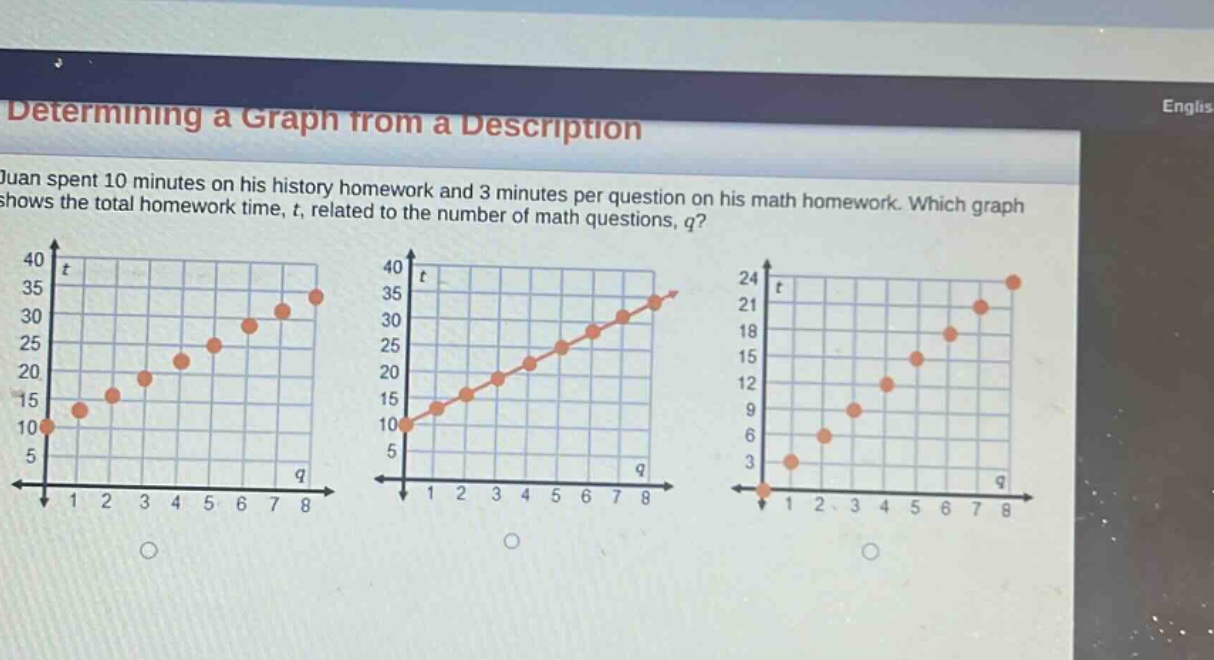
determining a graph from a description\njuan spent 10 minutes on his history homework and 3 minutes per question on his math homework. which graph shows the total homework time, t, related to the number of math questions, q?
Answer
Explanation:
Step1: Establish the equation
The time spent on history homework is 10 minutes and 3 minutes per math - question. So the total time (t) as a function of the number of math questions (q) is (t = 3q+10).
Step2: Analyze the y - intercept
When (q = 0) (no math questions), (t=3\times0 + 10=10). So the graph should cross the (t) - axis at (t = 10).
Step3: Analyze the slope
The slope of the line is 3, which means for each increase of 1 in (q), (t) increases by 3.
Answer:
The second graph (the one where the line starts at the point ((0,10)) on the (t) - axis and has a positive slope of 3).