when diego was a child, he and his dad planted a small apple tree. for the first few years, the tree grew…
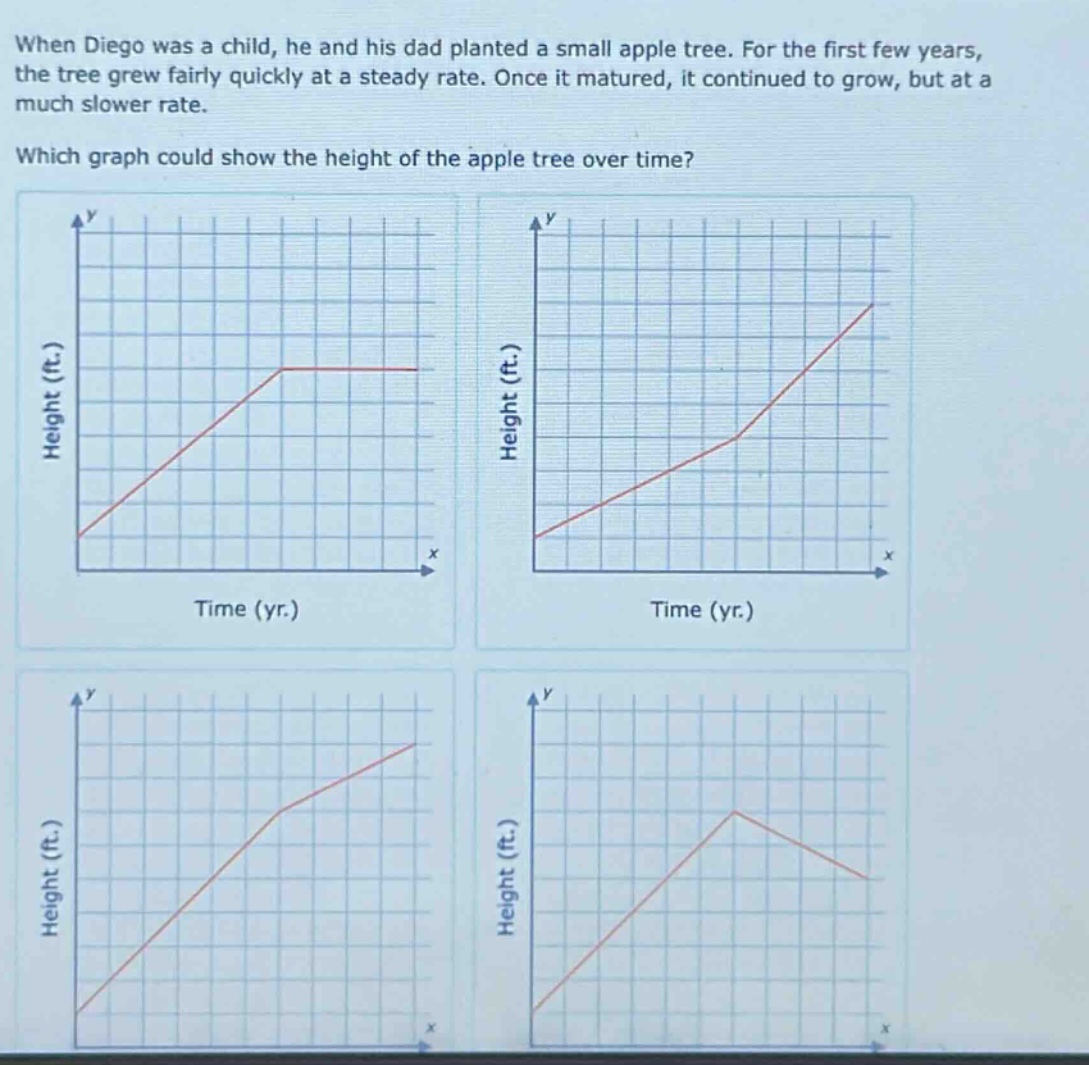
when diego was a child, he and his dad planted a small apple tree. for the first few years, the tree grew fairly quickly at a steady rate. once it matured, it continued to grow, but at a much slower rate. which graph could show the height of the apple tree over time?
Answer
Explanation:
Step1: Analyze the growth rate description
The tree grew fairly quickly at a steady rate first (so the initial part of the graph should have a relatively steep positive - slope line), then after maturing, it continued to grow but at a much slower rate (so the later part of the graph should have a less steep positive - slope line).
Step2: Examine each graph
- The first graph: After a certain point, the height stops increasing (horizontal line), which is not in line with “continued to grow”
- The second graph: The later part has a steeper slope, which is contrary to “slower rate”
- The third graph: The initial part has a steeper slope (fast growth) and the later part has a less steep slope (slow growth), which matches the description
- The fourth graph: The height decreases at the end, which is not in line with “continued to grow”
Answer:
The third graph (the one in the lower - left position among the four graphs)