an electrician is hired to install a ceiling fan. she estimates that the installation will take no more than…
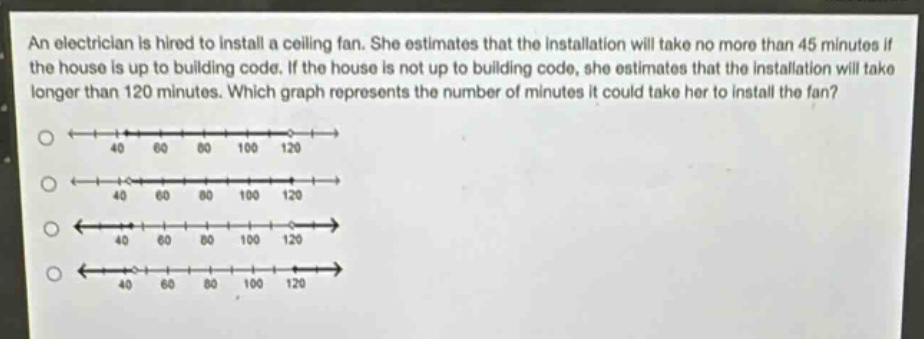
an electrician is hired to install a ceiling fan. she estimates that the installation will take no more than 45 minutes if the house is up to building code. if the house is not up to building code, she estimates that the installation will take longer than 120 minutes. which graph represents the number of minutes it could take her to install the fan?
Answer
Explanation:
Step1: Analyze the conditions
Let $t$ be the time to install the fan. If the house is up - to - code, $t\leq45$. If the house is not up - to - code, $t > 120$.
Step2: Interpret on the number line
The first condition $t\leq45$ is represented by a ray starting from negative infinity and ending at 45 with a closed circle (because 45 is included). The second condition $t>120$ is represented by a ray starting from 120 (with an open circle since 120 is not included) and going to positive infinity.
Answer:
The graph that has a ray going to the left from 45 (closed - circle at 45) and a ray going to the right from 120 (open - circle at 120)