emma earns $6 each time she mows the lawn and $8 per hour for babysitting. she is saving up to buy a new…
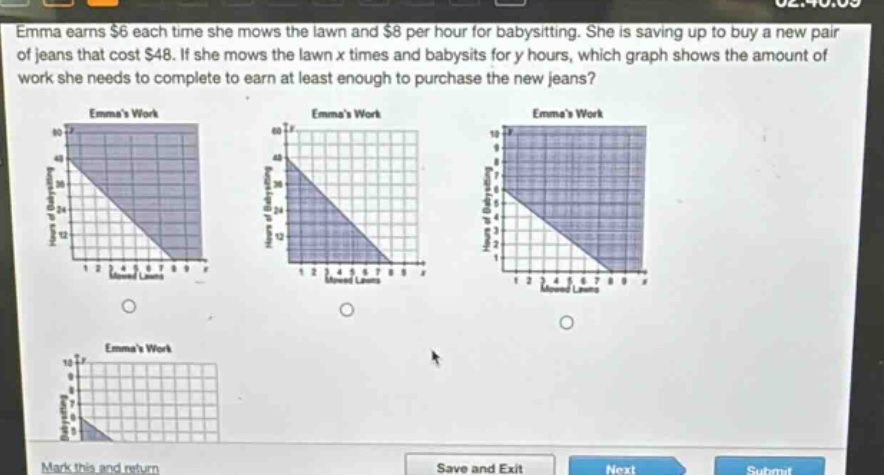
emma earns $6 each time she mows the lawn and $8 per hour for babysitting. she is saving up to buy a new pair of jeans that cost $48. if she mows the lawn x times and babysits for y hours, which graph shows the amount of work she needs to complete to earn at least enough to purchase the new jeans?
Answer
Explanation:
Step1: Set up the inequality
Emma earns $6 per lawn - mowing (x times) and $8 per hour of babysitting (y hours), and she needs at least $48. So the inequality is $6x + 8y\geq48$.
Step2: Rewrite the inequality in slope - intercept form
First, solve $6x + 8y\geq48$ for y. Subtract 6x from both sides: $8y\geq - 6x + 48$. Then divide by 8: $y\geq-\frac{6}{8}x+\frac{48}{8}$, which simplifies to $y\geq-\frac{3}{4}x + 6$. The boundary line is $y =-\frac{3}{4}x + 6$, and since the inequality is $\geq$, the region above the line (including the line itself) is the solution set. Also, since x (number of lawn - mowings) and y (number of babysitting hours) cannot be negative in this context, we are in the first - quadrant.
Answer:
The graph with a solid line $y =-\frac{3}{4}x + 6$ and the region above the line (in the first - quadrant) is the correct one. Without specific labels for the graphs, we can't point to a particular letter - named graph, but it should be the one with a solid line having a y - intercept of 6 and a slope of $-\frac{3}{4}$ and the shaded region above the line in the first quadrant.