the entire graph of the function h is shown in the figure below. write the domain and range of h as…
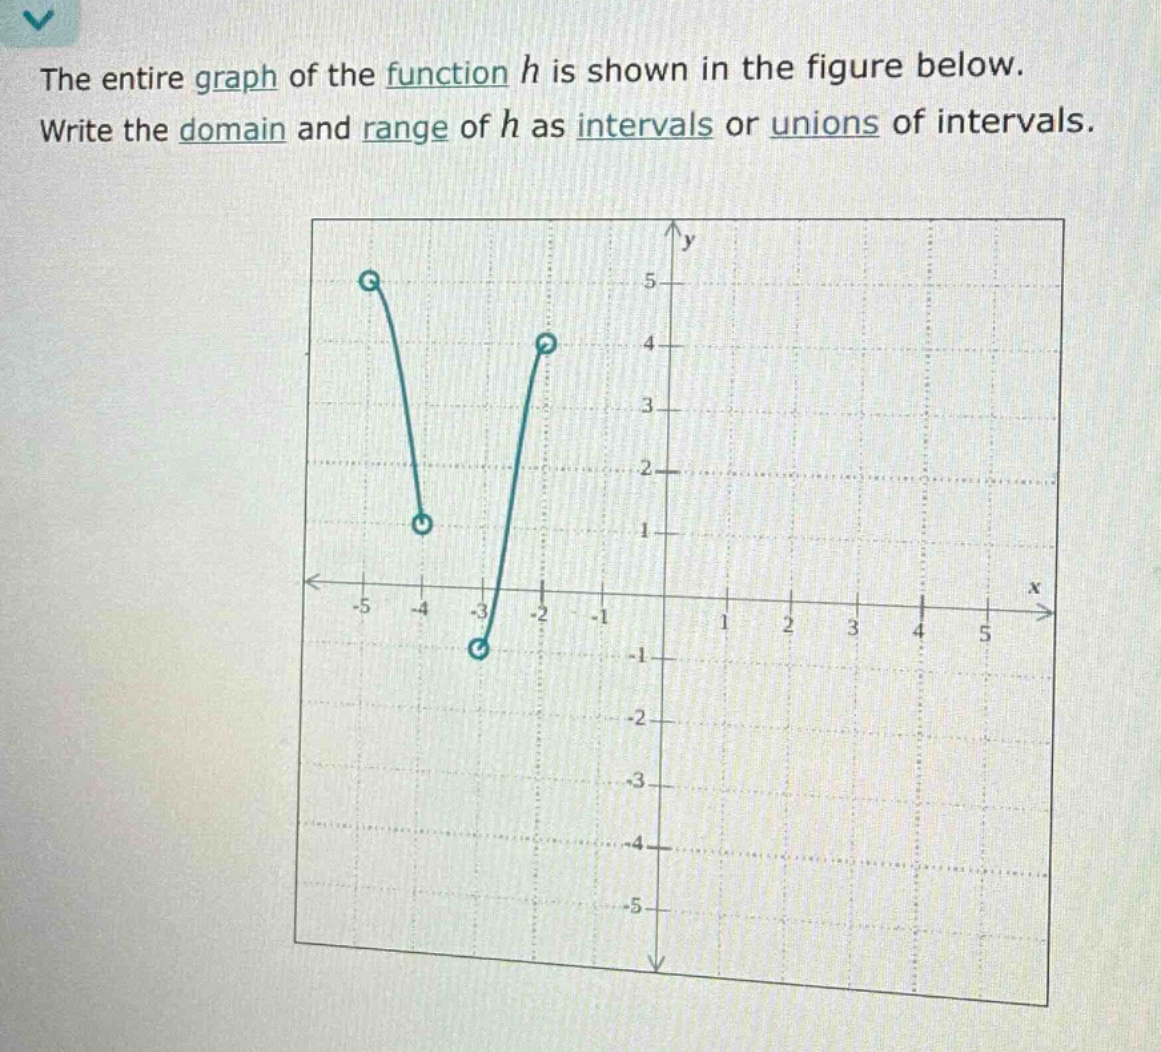
the entire graph of the function h is shown in the figure below. write the domain and range of h as intervals or unions of intervals.
Answer
Explanation:
Step1: Identify domain from x - values
The left - most x - value of the graph is at (x=-4) (open - circle) and the right - most is at (x = - 2) (open - circle). The domain is the set of all x - values for which the function is defined. So the domain is the open interval ((-4,-2)).
Step2: Identify range from y - values
The lowest y - value of the graph is at (y=-1) (open - circle) and the highest is at (y = 5) (open - circle). The range is the set of all y - values that the function takes. So the range is the open interval ((-1,5)).
Answer:
Domain: ((-4,-2)) Range: ((-1,5))