the entire graph of the function $h$ is shown in the figure below.\n\nwrite the domain and range of $h$…
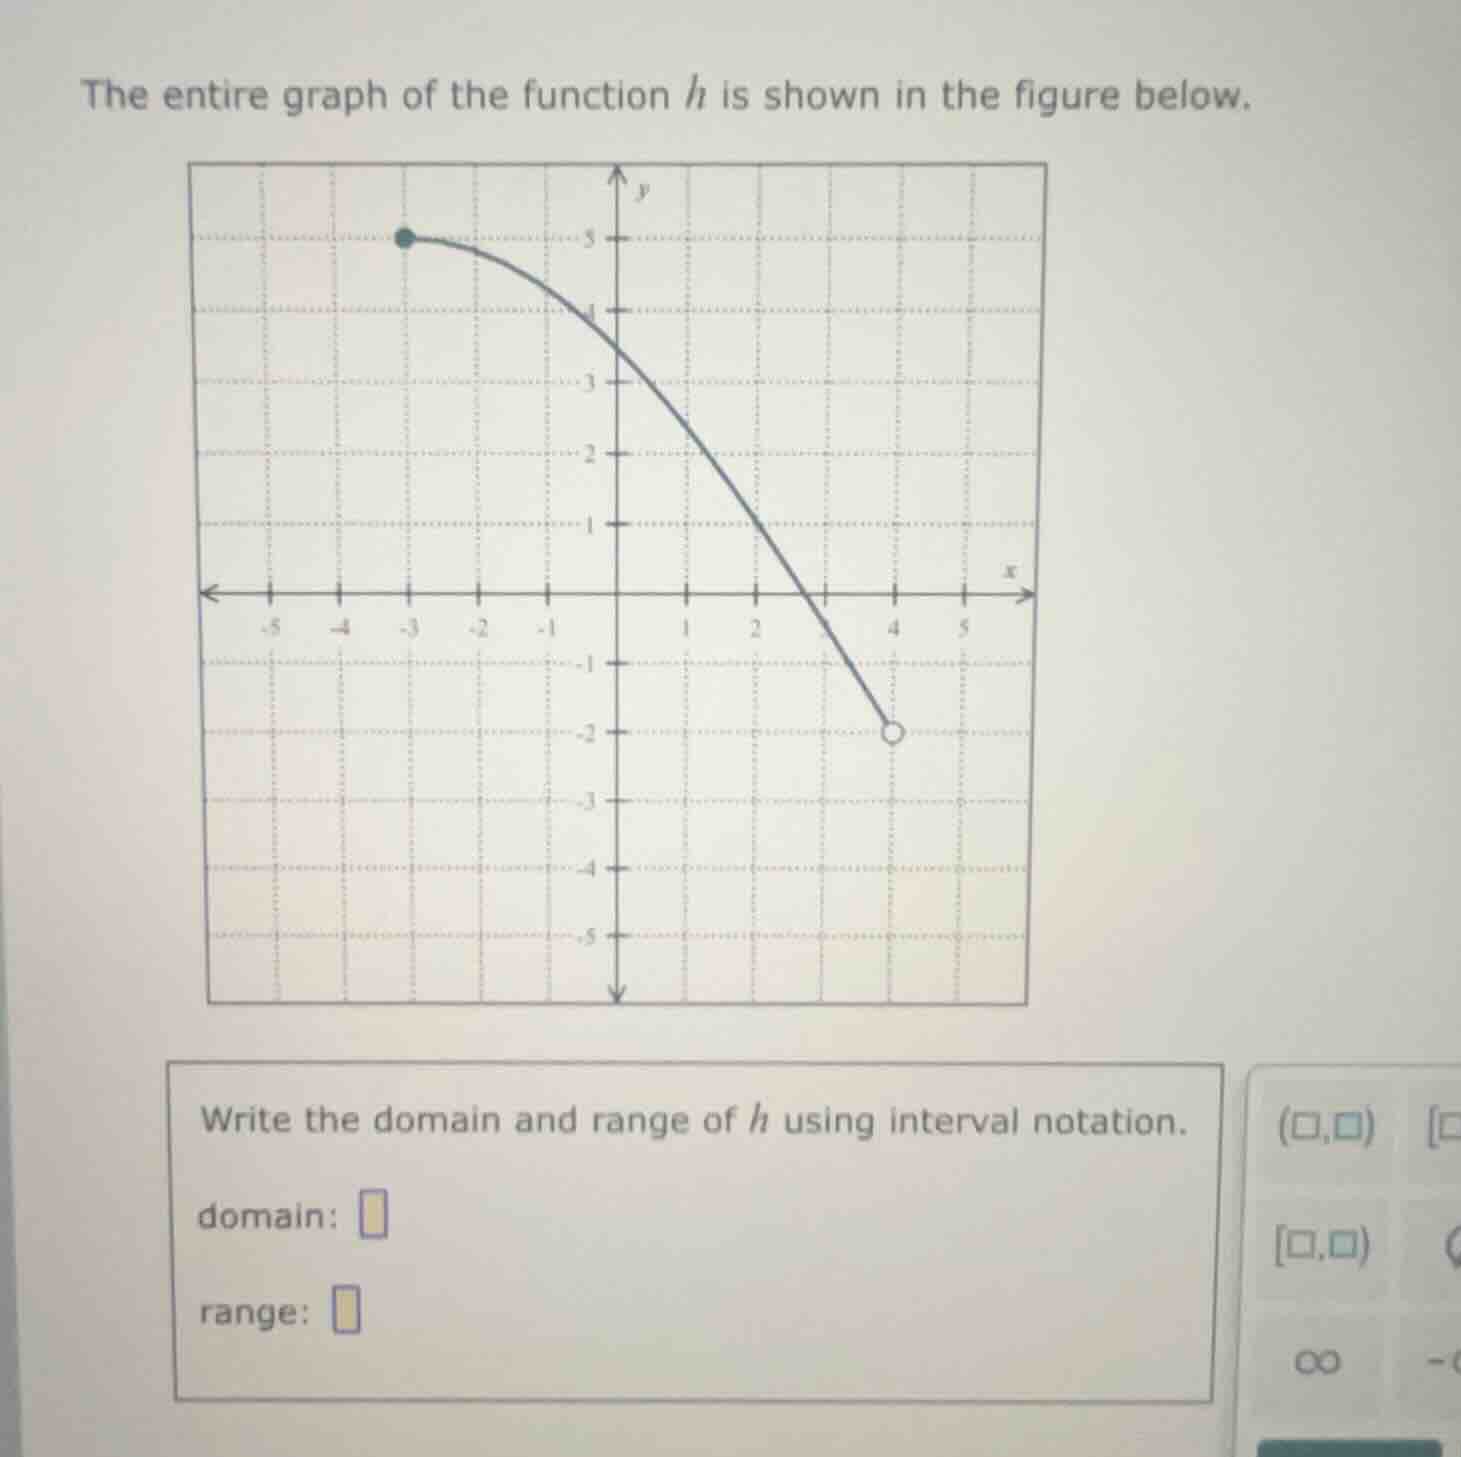
the entire graph of the function $h$ is shown in the figure below.\n\nwrite the domain and range of $h$ using interval notation.\ndomain: \nrange:
Answer
Explanation:
Step1: Identify domain from graph
The graph starts at a closed dot at $x=-3$ (included) and ends at an open dot at $x=4$ (not included). All $x$-values between these are covered. Domain: $[-3, 4)$
Step2: Identify range from graph
The lowest $y$-value is an open dot at $y=-2$ (not included), and the highest $y$-value is a closed dot at $y=5$ (included). All $y$-values between these are covered. Range: $(-2, 5]$
Answer:
domain: $[-3, 4)$ range: $(-2, 5]$