the equation y = 8.1x models the relationship between the number of hours alexander works, x, and the dollar…
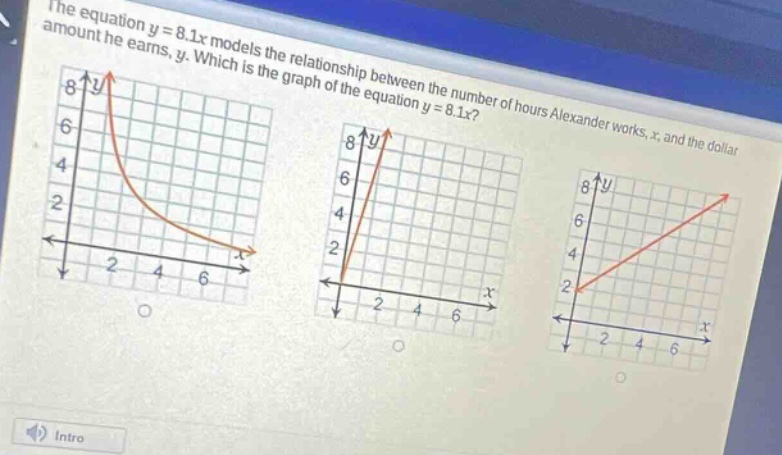
the equation y = 8.1x models the relationship between the number of hours alexander works, x, and the dollar amount he earns, y. which is the graph of the equation y = 8.1x?
Answer
Explanation:
Step1: Identify the form of the equation
The equation $y = 8.1x$ is in the form of a linear - equation $y=mx + b$, where $m = 8.1$ and $b = 0$.
Step2: Recall the properties of a linear - equation graph
The graph of a linear equation $y=mx + b$ is a straight line. When $b = 0$, the line passes through the origin $(0,0)$. The slope $m=8.1>0$, so the line has a positive slope and rises from left to right.
Answer:
The graph that is a straight - line passing through the origin and rising from left to right. (The second graph among the options shown in the picture is likely the correct one as it is a straight line passing through the origin with a positive slope)