which of the following is the graph of $y = sqrt{-x - 3}$?
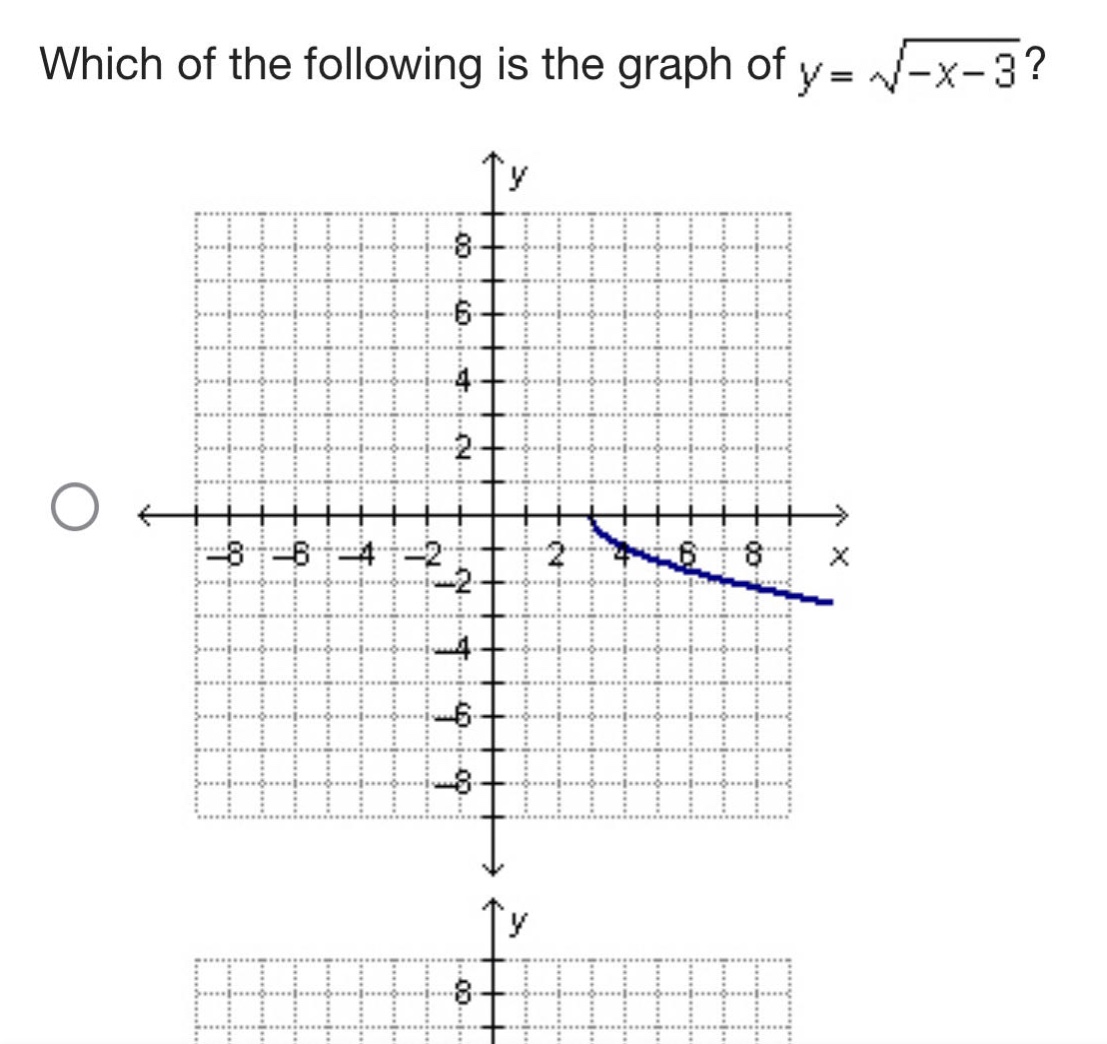
which of the following is the graph of $y = sqrt{-x - 3}$?
Answer
Explanation:
Step1: Find the domain
For $y = \sqrt{-x - 3}$, the expression under the square - root must be non - negative. So, $-x-3\geq0$, which gives $x\leq - 3$.
Step2: Analyze the behavior
When $x=-3$, $y = 0$. As $x$ decreases (since $x\leq - 3$), the value of $y=\sqrt{-x - 3}$ increases.
Answer:
The graph should start at the point $(-3,0)$ and extend to the left (negative $x$ - direction) with $y\geq0$. Since no other graphs are provided for comparison, based on the domain and behavior analysis, the correct graph should have its left - most point at $(-3,0)$ and be above the $x$ - axis for $x\leq - 3$.