given the function below, fill in the table of values and use the table values to graph.\n\n$y = x - 2$\n\n|…
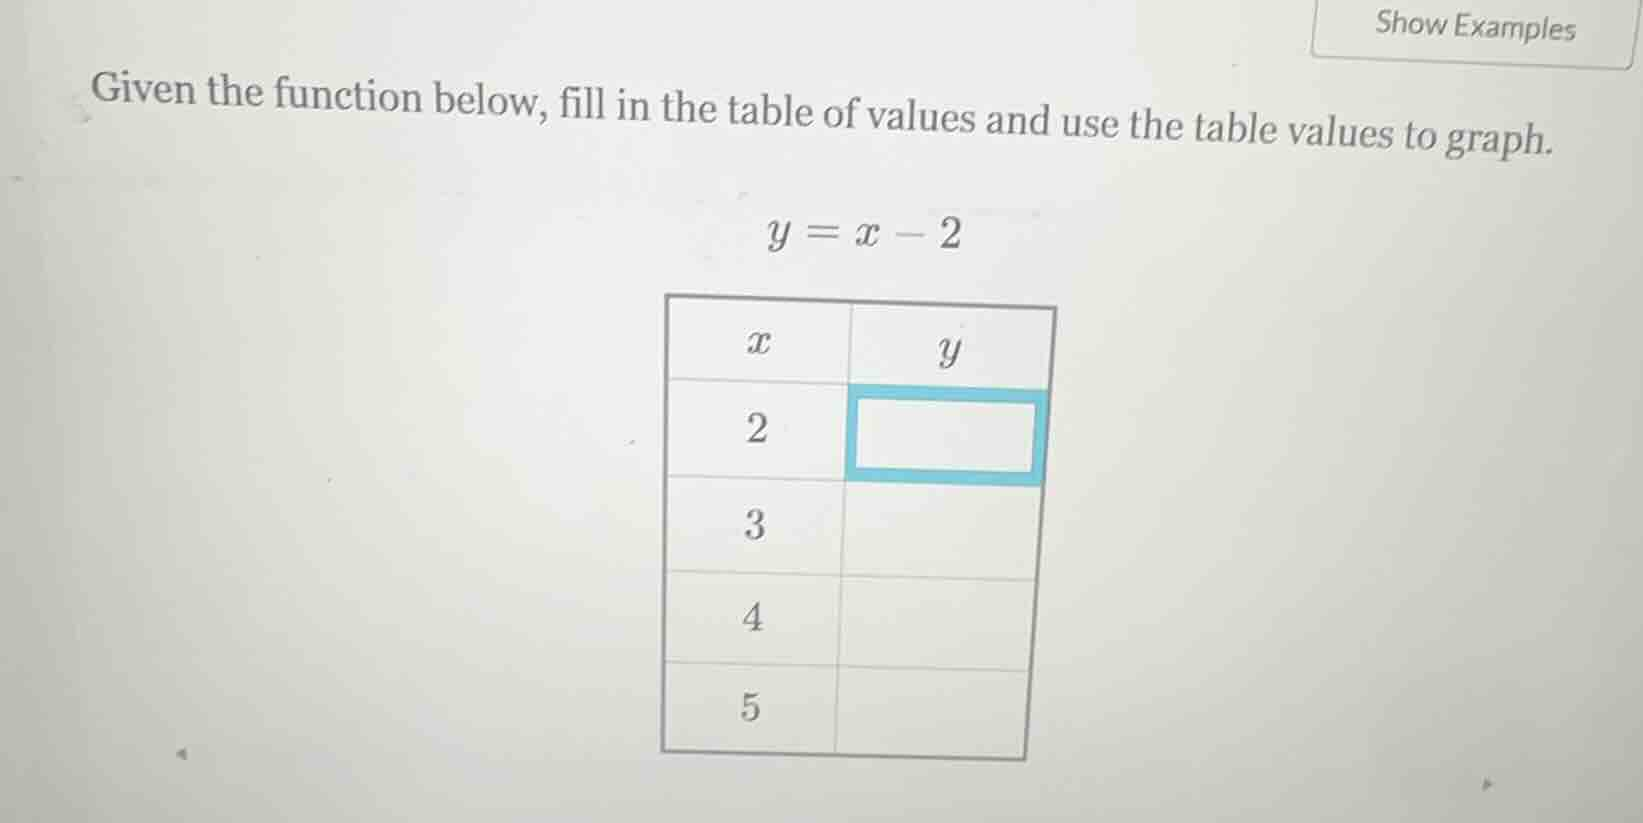
given the function below, fill in the table of values and use the table values to graph.\n\n$y = x - 2$\n\n| $x$ | $y$ |\n| :--- | :--- |\n| 2 | |\n| 3 | |\n| 4 | |\n| 5 | |
Answer
Explanation:
Step1: Identify the linear function
$$y = x - 2$$
Step2: Substitute $x = 2$ into the function
$$y = 2 - 2 = 0$$
Step3: Substitute $x = 3$ into the function
$$y = 3 - 2 = 1$$
Step4: Substitute $x = 4$ into the function
$$y = 4 - 2 = 2$$
Step5: Substitute $x = 5$ into the function
$$y = 5 - 2 = 3$$
Answer:
| $x$ | $y$ |
|---|---|
| 2 | 0 |
| 3 | 1 |
| 4 | 2 |
| 5 | 3 |
The graph is a straight line passing through the points $(2, 0)$, $(3, 1)$, $(4, 2)$, and $(5, 3)$.