the given graph represents the function f(x)=2(5)^x. how will the appearance of the graph change if the a…
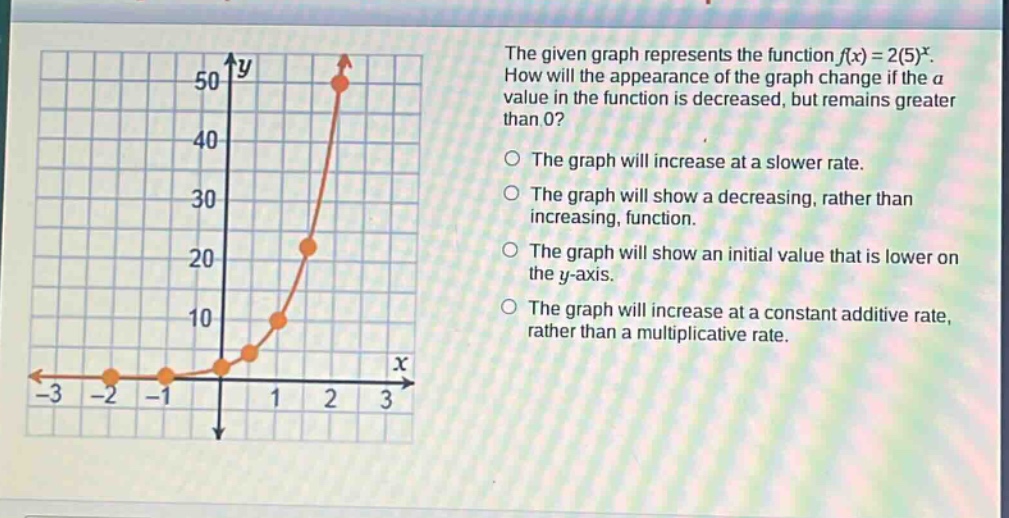
the given graph represents the function f(x)=2(5)^x. how will the appearance of the graph change if the a value in the function is decreased, but remains greater than 0? the graph will increase at a slower rate. the graph will show a decreasing, rather than increasing, function. the graph will show an initial value that is lower on the y - axis. the graph will increase at a constant additive rate, rather than a multiplicative rate.
Answer
Brief Explanations:
The general form of an exponential function is $y = a\cdot b^x$, where $a$ is the initial - value (the value of the function when $x = 0$). For the function $f(x)=2(5)^x$, when $x = 0$, $f(0)=2$. If $a$ is decreased but remains greater than 0, the value of the function at $x = 0$ will be lower, which means the initial value on the $y$-axis will be lower.
Answer:
The graph will show an initial value that is lower on the $y$-axis.