which is the graph of 2x + 3y > -3?
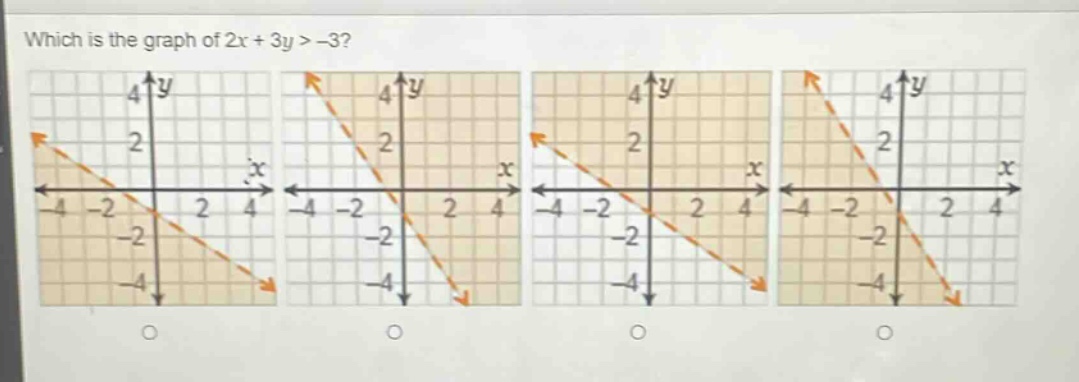
which is the graph of 2x + 3y > -3?
Answer
Explanation:
Step1: Rewrite the inequality in slope - intercept form
First, solve $2x + 3y>-3$ for $y$. Subtract $2x$ from both sides: $3y>-2x - 3$. Then divide by 3: $y>-\frac{2}{3}x - 1$.
Step2: Analyze the boundary line
The boundary line of the inequality $y>-\frac{2}{3}x - 1$ is the equation $y =-\frac{2}{3}x - 1$. The slope $m=-\frac{2}{3}$ and the $y$-intercept $b = - 1$. Since the inequality is $y>-\frac{2}{3}x - 1$, the boundary line is a dashed line (because the inequality is strict, $y$ is greater than, not greater than or equal to).
Step3: Test a point
Choose a test - point not on the line, say $(0,0)$. Substitute $x = 0$ and $y = 0$ into the original inequality $2x+3y>-3$. We get $2(0)+3(0)=0>-3$, which is true. So, the region that contains the point $(0,0)$ is the solution region.
The graph with a dashed line $y =-\frac{2}{3}x - 1$ and the region above the line (including the region that contains the origin $(0,0)$) is the correct graph.
Answer:
The graph with a dashed line having a slope of $-\frac{2}{3}$ and $y$-intercept of - 1 and the region above the line is the correct one. Without specific labels for the given graphs, based on the above - described characteristics, you can identify the correct graph among the options.