which is the graph of y = x - 2?
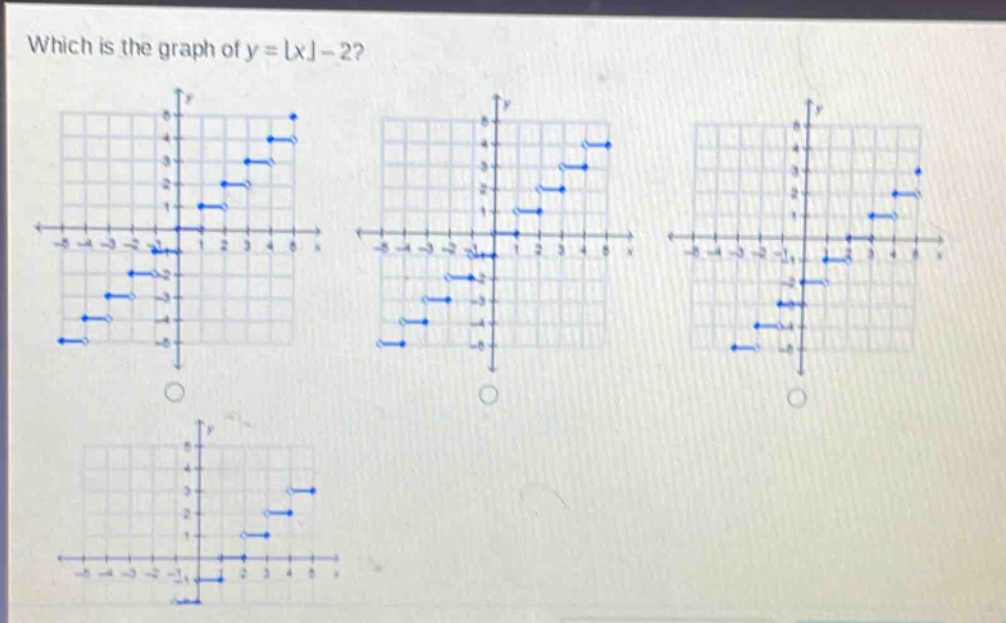
which is the graph of y = x - 2?
Answer
Explanation:
Step1: Recall the properties of the greatest - integer function
The greatest - integer function $y = \lfloor x\rfloor$ gives the greatest integer less than or equal to $x$. For example, $\lfloor 2.3\rfloor=2$, $\lfloor - 1.5\rfloor=-2$.
Step2: Analyze the transformation of the function $y=\lfloor x\rfloor - 2$
The function $y=\lfloor x\rfloor - 2$ is a vertical shift of the function $y = \lfloor x\rfloor$ down by 2 units. When $x\in[0,1)$, $\lfloor x\rfloor = 0$ and $y=\lfloor x\rfloor - 2=-2$. When $x\in[1,2)$, $\lfloor x\rfloor = 1$ and $y=\lfloor x\rfloor - 2=-1$, and so on. The graph of $y = \lfloor x\rfloor$ consists of horizontal line - segments with closed - circle on the left - hand end and open - circle on the right - hand end. The graph of $y=\lfloor x\rfloor - 2$ will have the same horizontal - line segment pattern but shifted 2 units down.
Since no options are labeled, assume we are looking for a graph where for $x\in[0,1)$ the $y$ - value is $-2$ (a horizontal line segment with a closed - circle at $x = 0$ and an open - circle at $x = 1$), for $x\in[1,2)$ the $y$ - value is $-1$ (a horizontal line segment with a closed - circle at $x = 1$ and an open - circle at $x = 2$) and so on, shifted 2 units down from the graph of $y=\lfloor x\rfloor$.
Answer:
The graph that has horizontal line - segments with closed - circles on the left and open - circles on the right, and is shifted 2 units down compared to the standard greatest - integer function graph.