which is the graph of x - y = 1?
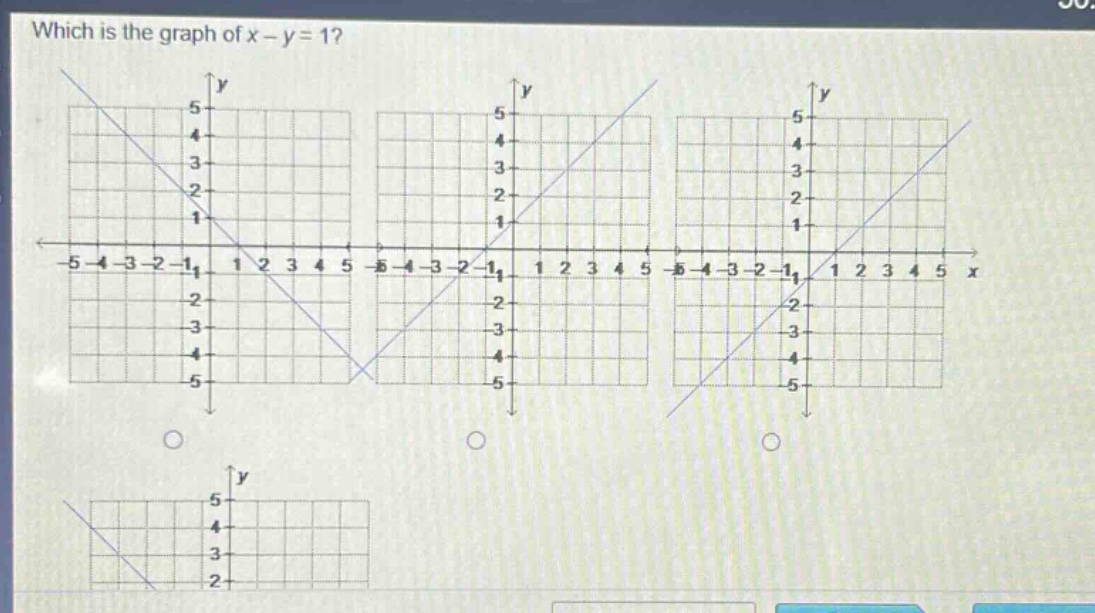
which is the graph of x - y = 1?
Answer
Explanation:
Step1: Rewrite the equation in slope - intercept form
We rewrite $x - y=1$ as $y=x - 1$. The slope - intercept form of a line is $y = mx + b$, where $m$ is the slope and $b$ is the y - intercept. Here, $m = 1$ and $b=-1$.
Step2: Analyze the slope and y - intercept
A slope of $m = 1$ means for every 1 unit increase in $x$, $y$ increases by 1 unit. The y - intercept $b=-1$ means the line crosses the y - axis at the point $(0,-1)$.
Step3: Identify the correct graph
We look for a line that has a positive slope and crosses the y - axis at $(0,-1)$.
Answer:
The graph with a positive slope and y - intercept of - 1. (Since no options are labeled, you would choose the graph that has a line rising from left to right and crossing the y - axis at the point $(0,-1)$ among the given graphs).