which is the graph of f(x) = √x?
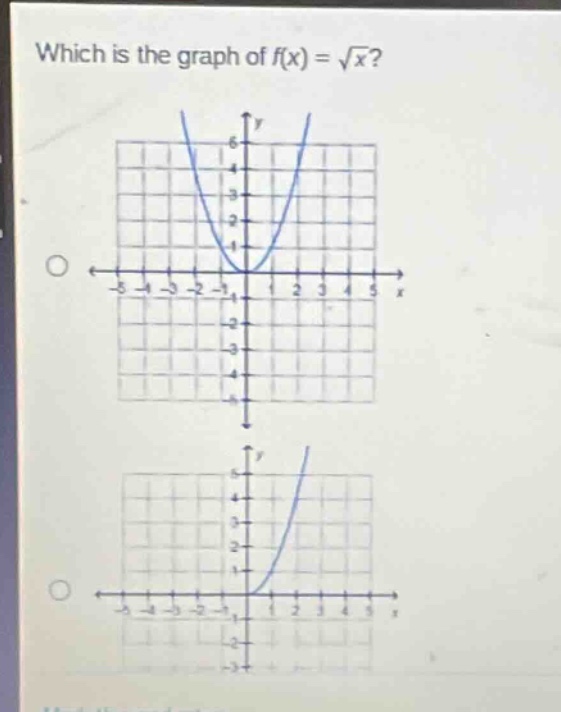
which is the graph of f(x) = √x?
Answer
Explanation:
Step1: Determine the domain of the function.
The function is $f(x) = \sqrt{x}$. The square root function is defined only for non-negative real numbers. Therefore, the domain of $f(x)$ is $x \ge 0$. This means the graph must lie on or to the right of the y-axis.
Step2: Determine the range of the function.
The principal square root $\sqrt{x}$ is always non-negative. Therefore, the range of $f(x)$ is $f(x) \ge 0$. This means the graph must lie on or above the x-axis.
Step3: Evaluate the function at some points.
Let's find a few points on the graph: When $x=0$, $f(0) = \sqrt{0} = 0$. The point (0, 0) is on the graph. When $x=1$, $f(1) = \sqrt{1} = 1$. The point (1, 1) is on the graph. When $x=4$, $f(4) = \sqrt{4} = 2$. The point (4, 2) is on the graph.
Step4: Compare the properties with the given graphs.
The first graph shows a parabola opening upwards, defined for all real $x$. This does not match the domain $x \ge 0$. The second graph starts at the origin (0, 0), exists only for $x \ge 0$ and $y \ge 0$, and passes through the point (1, 1). The shape is consistent with the square root function.
Answer:
The second graph represents the function $f(x) = \sqrt{x}$.