which graph best represents a quadratic function with a range of all real numbers greater than or equal to 3?
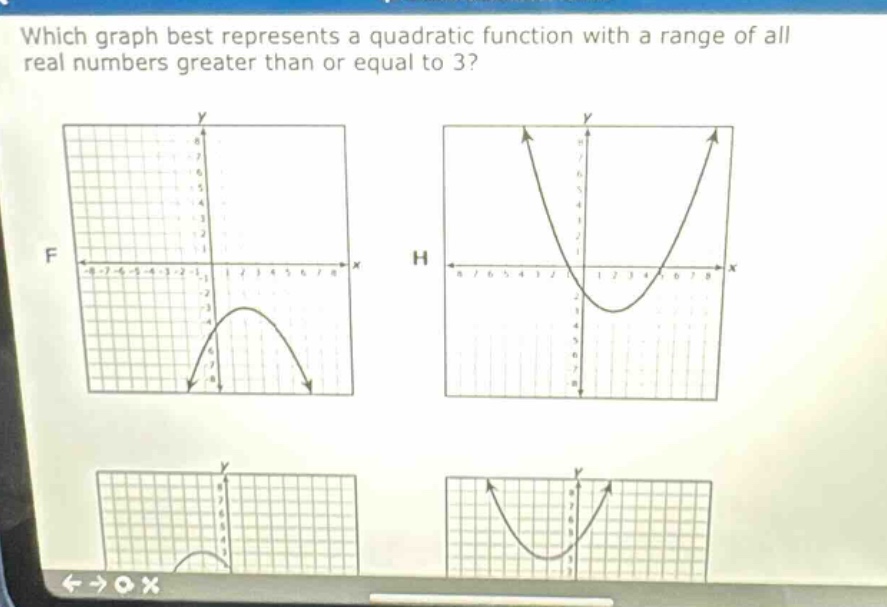
which graph best represents a quadratic function with a range of all real numbers greater than or equal to 3?
Answer
Answer:
The graph that opens upwards and has its vertex at the point where (y = 3) best represents the quadratic function. Among the given options, if there is a parabola that opens upwards and has its lowest - point (vertex) at (y = 3), that is the correct graph. Without seeing all the options clearly, a general description is that a quadratic function of the form (y=a(x - h)^2+3) where (a>0) will have a range of (y\geq3). The graph will be a parabola opening upwards with the vertex at the point ((h,3)).
Explanation:
Step1: Recall quadratic function properties
A quadratic function is of the form (y = ax^{2}+bx + c) or (y=a(x - h)^2+k). The value of (a) determines the direction of the parabola. If (a>0), the parabola opens upwards; if (a < 0), it opens downwards. The vertex of the parabola given in vertex - form is ((h,k)).
Step2: Analyze the range condition
The range of a quadratic function (y=a(x - h)^2+k) is (y\geq k) when (a>0) (opens upwards) and (y\leq k) when (a < 0) (opens downwards). We want a range of (y\geq3), so the parabola must open upwards ((a>0)) and have (k = 3) (the (y) - coordinate of the vertex). So we look for a graph of a parabola that opens upwards and has its lowest point at (y = 3).