how does the graph of y = √x + 2 compare to the graph of the parent square root function?\nthe graph is a…
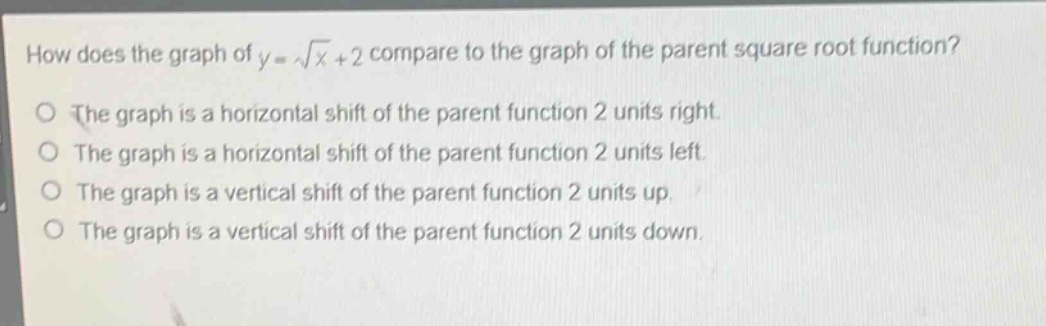
how does the graph of y = √x + 2 compare to the graph of the parent square root function?\nthe graph is a horizontal shift of the parent function 2 units right.\nthe graph is a horizontal shift of the parent function 2 units left.\nthe graph is a vertical shift of the parent function 2 units up.\nthe graph is a vertical shift of the parent function 2 units down.
Answer
Answer:
C. The graph is a vertical shift of the parent function 2 units up.
Explanation:
Step1: Recall parent - function form
The parent square - root function is $y = \sqrt{x}$.
Step2: Analyze the transformation
For a function $y=f(x)+k$, when $k>0$, it represents a vertical shift. Here, the given function is $y=\sqrt{x}+2$, where $k = 2$. A positive $k$ value means the graph of $y = f(x)$ (the parent function $y=\sqrt{x}$) is shifted $k$ units up. So the graph of $y=\sqrt{x}+2$ is a vertical shift of the parent square - root function 2 units up.