the graph depicts the growth in costs using a line segment. use the midpoint formula to approximate the cost…
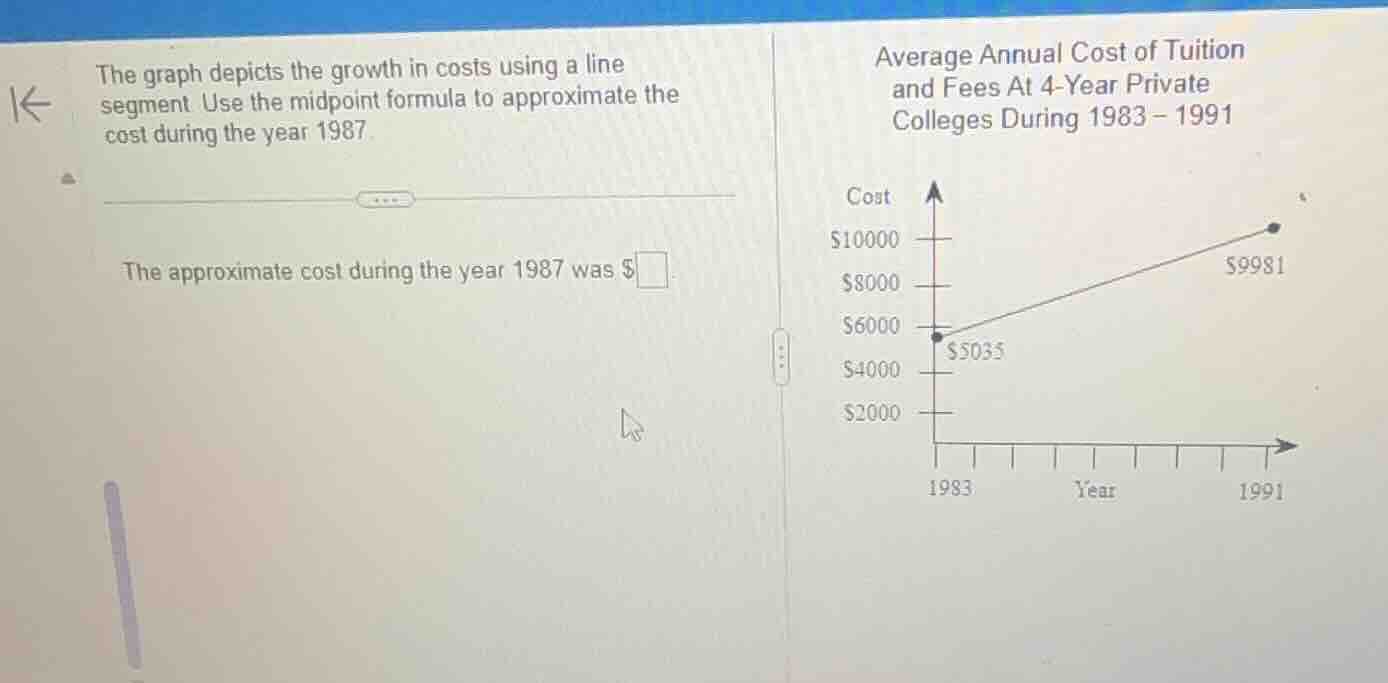
the graph depicts the growth in costs using a line segment. use the midpoint formula to approximate the cost during the year 1987.\nthe approximate cost during the year 1987 was $\\square.\naverage annual cost of tuition and fees at 4-year private colleges during 1983 – 1991\ncost\n$10000\n$8000\n$6000\n$5035\n$4000\n$2000\n1983\nyear\n1991\n$9981
Answer
Explanation:
Step1: Identify the two points
The two points are (1983, 5035) and (1991, 9981). We need to find the midpoint of the cost (since 1987 is the midpoint of 1983 and 1991 in terms of years). The midpoint formula for two values ( y_1 ) and ( y_2 ) is ( \frac{y_1 + y_2}{2} ).
Step2: Apply the midpoint formula
Substitute ( y_1 = 5035 ) and ( y_2 = 9981 ) into the formula: ( \frac{5035 + 9981}{2} = \frac{15016}{2} = 7508 )
Answer:
7508