graph the equation.\ny = 2|x|
graph the equation.\ny = 2|x|
Answer
Explanation:
Step1: Analyze when x ≥ 0
When (x\geq0), (|x| = x), so the equation becomes (y = 2x). We can find some points. When (x = 0), (y=2\times0 = 0); when (x = 1), (y = 2\times1=2); when (x = 2), (y=2\times2 = 4).
Step2: Analyze when x < 0
When (x<0), (|x|=-x), so the equation becomes (y=- 2x). When (x=-1), (y=-2\times(-1)=2); when (x = - 2), (y=-2\times(-2)=4).
Step3: Plot the points
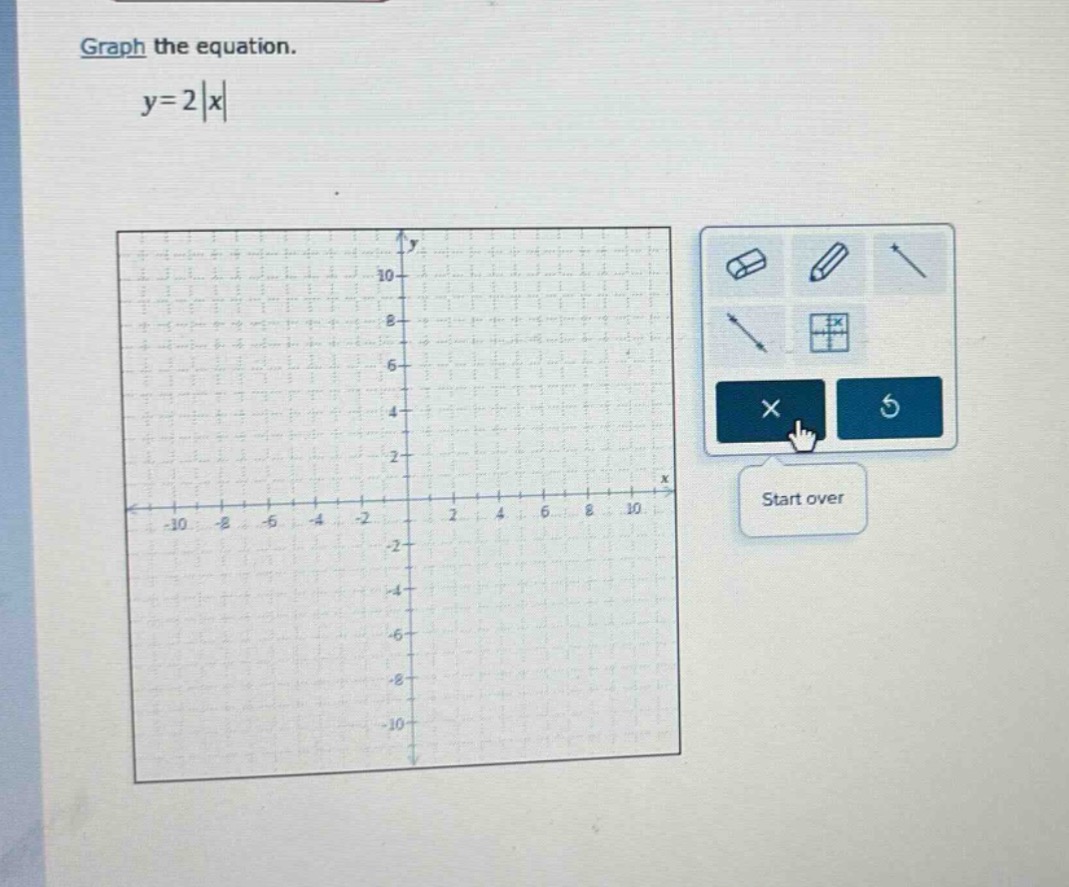
Plot the points ((0,0)), ((1,2)), ((2,4)), ((-1,2)), ((-2,4)) on the coordinate - plane and connect them with straight - line segments. The graph is a "V" shape with the vertex at the origin ((0,0)) opening upwards.
Answer:
The graph of (y = 2|x|) is a "V" - shaped graph with the vertex at the origin ((0,0)) opening upwards, formed by connecting the points ((0,0)), ((1,2)), ((2,4)), ((-1,2)), ((-2,4)) and other points obtained from the two linear functions (y = 2x) ((x\geq0)) and (y=-2x) ((x < 0)) with straight - line segments.