the graph in the figure is a horizontal and/or vertical shift of the graph of $y = x^2$. find a formula for…
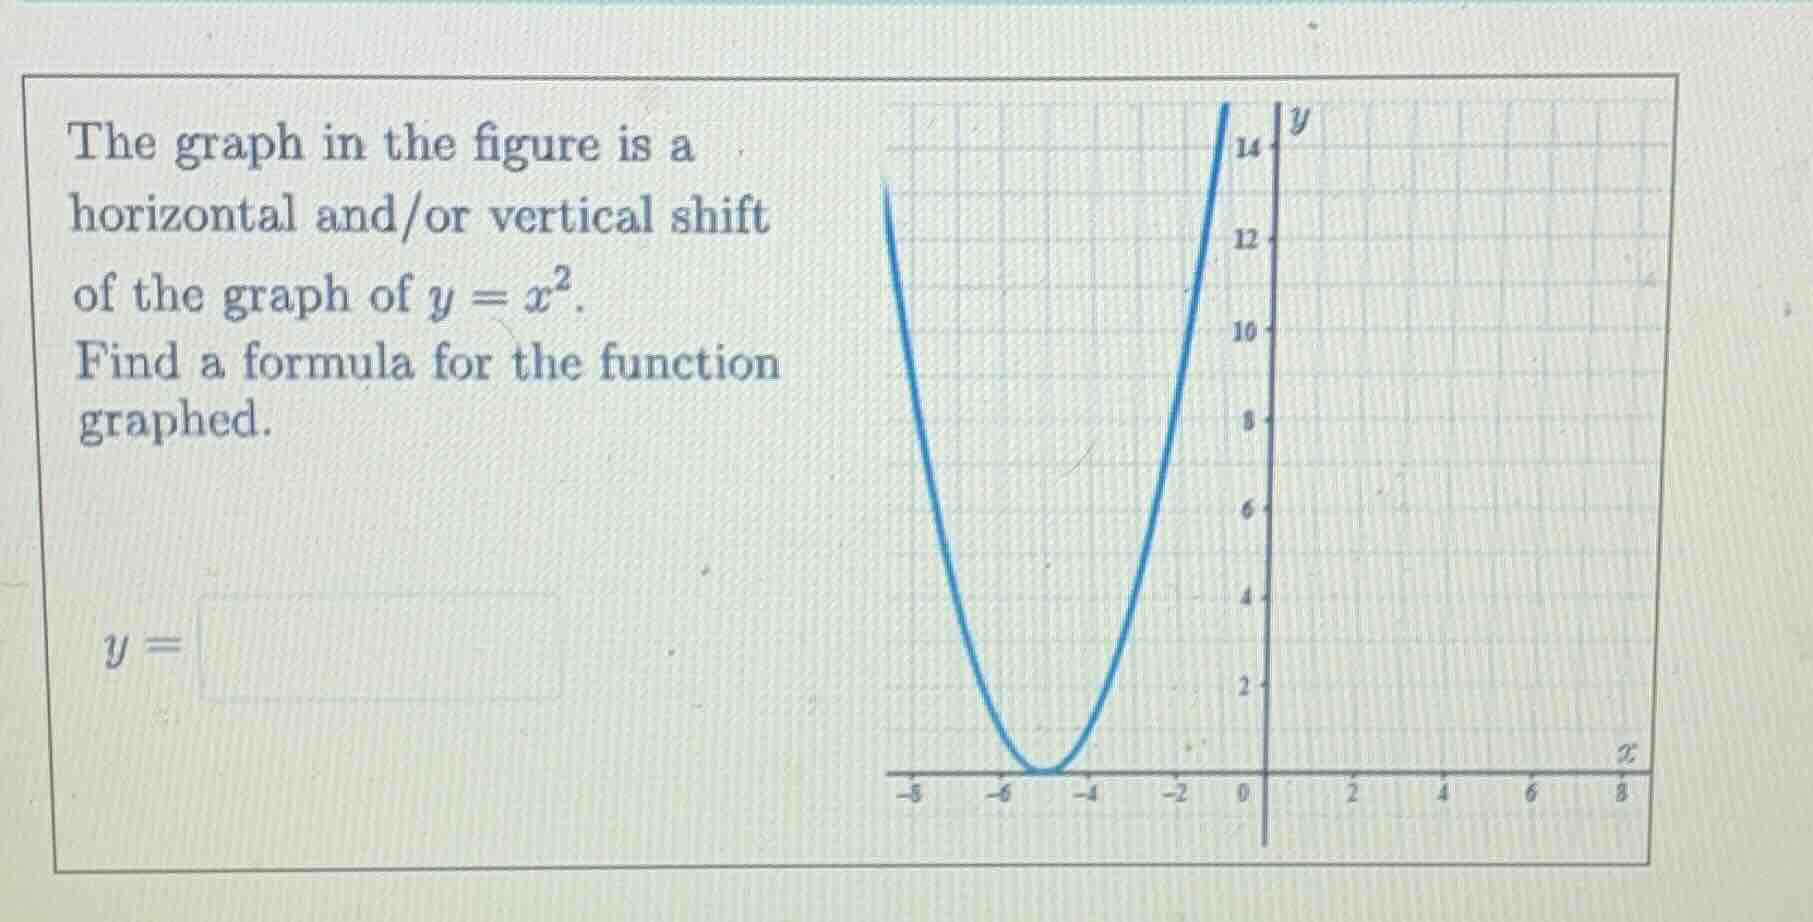
the graph in the figure is a horizontal and/or vertical shift of the graph of $y = x^2$. find a formula for the function graphed.\n\n$y = $
Answer
Explanation:
Step1: Identify the vertex of the parabola
The vertex $(h, k)$ is the lowest point on the graph. $$(h, k) = (-5, 0)$$
Step2: Determine the horizontal shift
The graph of $y = x^2$ is shifted left by 5 units. $$h = -5$$
Step3: Determine the vertical shift
The graph is not shifted vertically from the x-axis. $$k = 0$$
Step4: Apply the vertex form equation
Substitute $h$ and $k$ into the vertex form $y = (x - h)^2 + k$. $$y = (x - (-5))^2 + 0$$
Step5: Simplify the formula
Simplify the expression inside the parentheses. $$y = (x + 5)^2$$
Answer:
y = (x + 5)^2