graph this function: y = |x| - 5 click to plot the vertex first.
graph this function: y = |x| - 5 click to plot the vertex first.
Answer
Explanation:
Step 1: Identify the vertex of the absolute value function
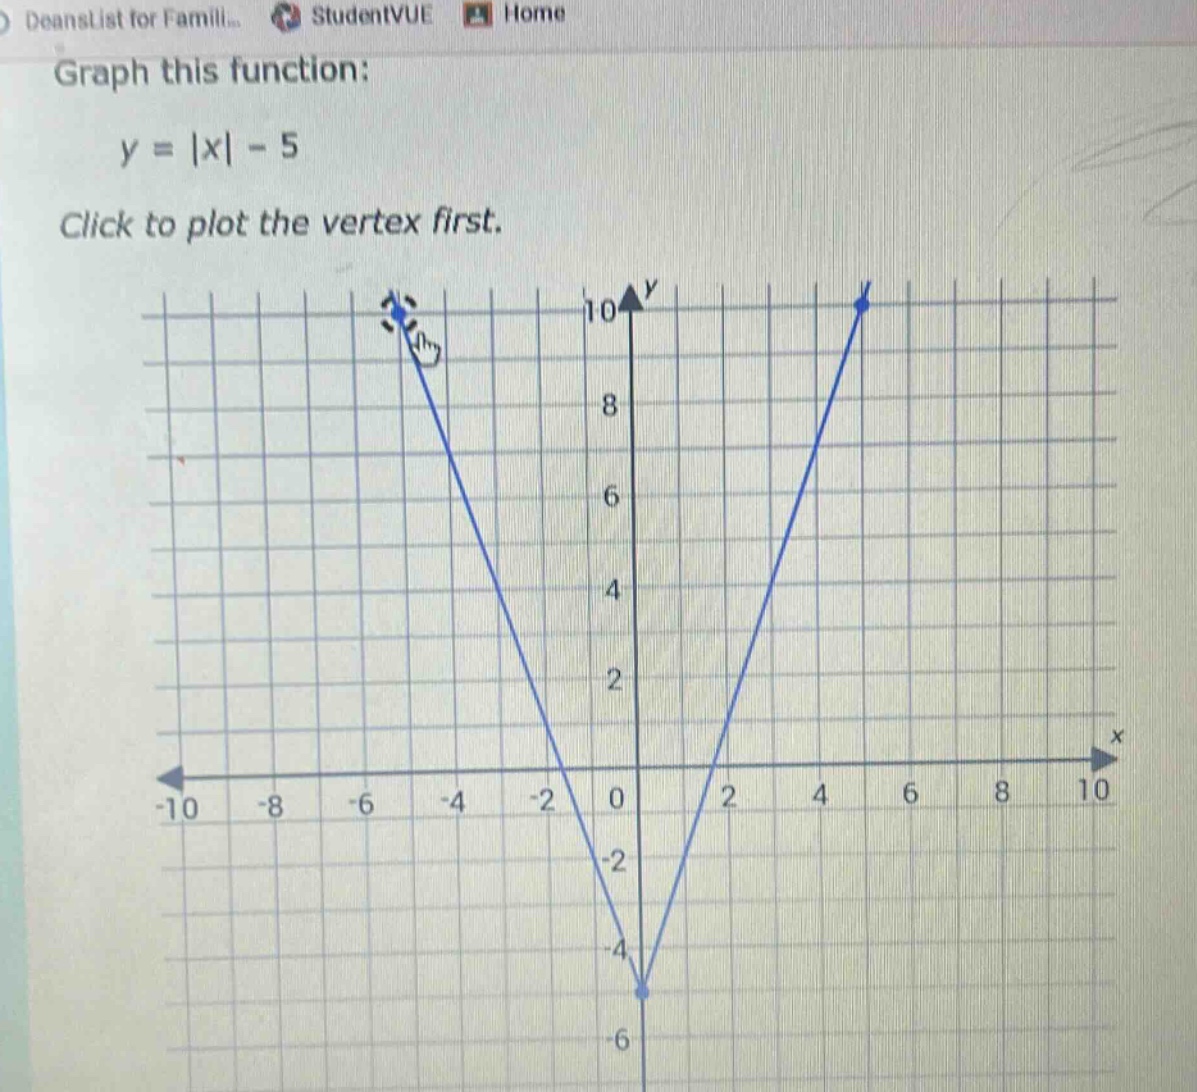
The parent function ( y = |x| ) has a vertex at ((0, 0)). The given function ( y = |x| - 5 ) is a vertical shift down by 5 units, so the vertex shifts to ((0, -5)).
Step 2: Determine the expressions for ( x \geq 0 ) and ( x < 0 )
For ( x \geq 0 ), the function simplifies to ( y = x - 5 ). For ( x < 0 ), the function simplifies to ( y = -x - 5 ). These are linear functions with slopes 1 and -1, respectively.
Step 3: Plot the vertex and draw the lines
Plot the vertex at ((0, -5)). For ( x \geq 0 ), use the slope 1 to draw a line increasing to the right. For ( x < 0 ), use the slope -1 to draw a line increasing to the left.
Answer:
The vertex is plotted at ((0, -5)), with two straight lines forming a "V" shape: one with slope 1 for ( x \geq 0 ) and one with slope -1 for ( x < 0 ).