the graph of a function is given below. give all y - intercepts and x - intercepts shown. if there is more…
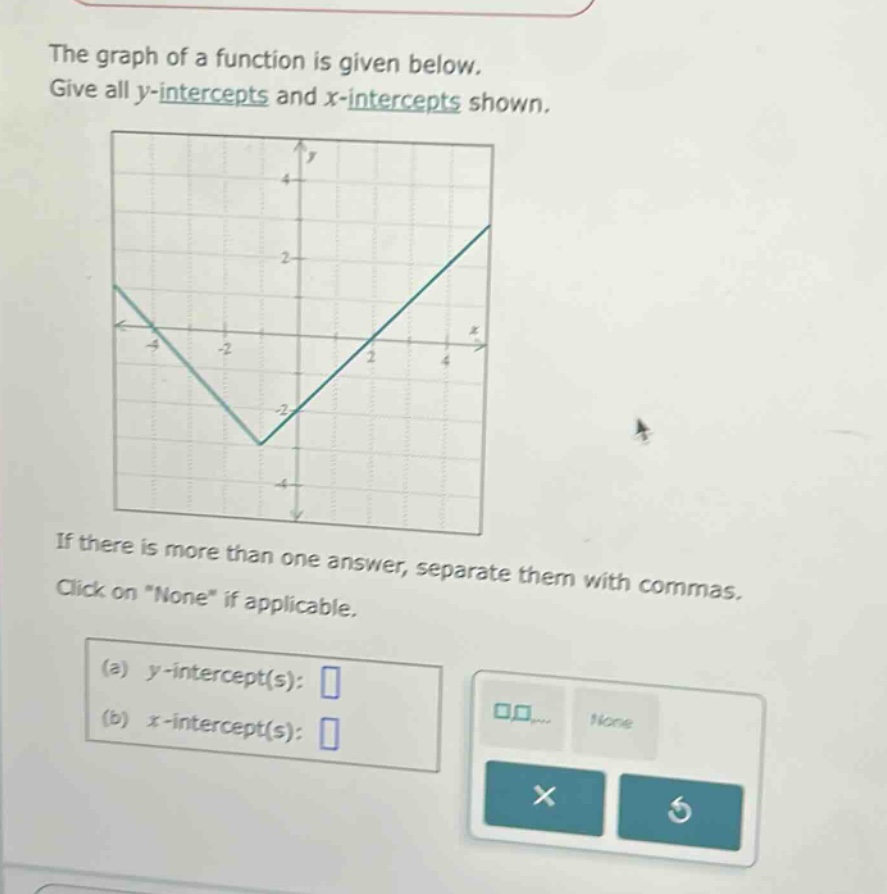
the graph of a function is given below. give all y - intercepts and x - intercepts shown. if there is more than one answer, separate them with commas. click on \none\ if applicable. (a) y - intercept(s): (b) x - intercept(s):
Answer
Explanation:
Step1: Recall y - intercept definition
The y - intercept is the value of y when x = 0.
Step2: Locate on the graph
From the graph, when x = 0, y=-2. So the y - intercept is - 2.
Step3: Recall x - intercept definition
The x - intercept is the value of x when y = 0.
Step4: Locate on the graph
The graph intersects the x - axis at x=-3 and x = 1. So the x - intercepts are - 3,1.
Answer:
(a) -2 (b) -3,1