the graph of a function is given. graph the inverse function.
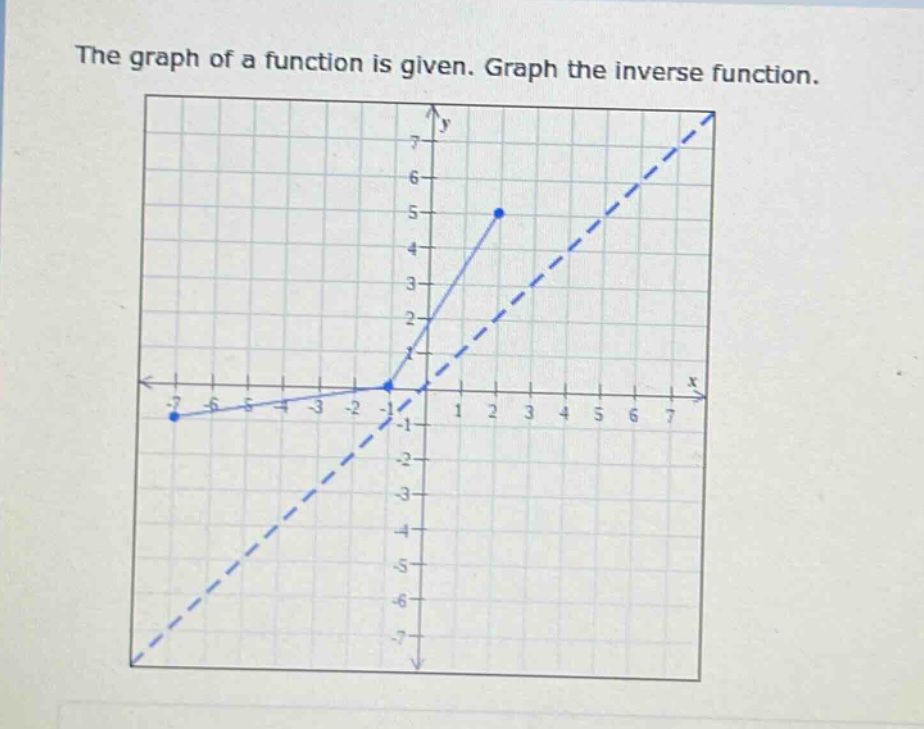
the graph of a function is given. graph the inverse function.
Answer
Explanation:
Step1: Recall the property of inverse - function graphs
The graph of a function (y = f(x)) and its inverse (y = f^{-1}(x)) are symmetric about the line (y=x).
Step2: Identify key points on the original function
Let's assume some key points on the given function graph. For example, if we have a point ((x_1,y_1)) on the function (y = f(x)), then the point ((y_1,x_1)) will be on the inverse function (y = f^{-1}(x)). Suppose a point on the given function is ((- 7,-1)), then the corresponding point on the inverse function is ((-1,-7)). Another point on the given function is ((0,2)), so the corresponding point on the inverse is ((2,0)), and if there is a point ((2,5)) on the given function, then ((5,2)) is on the inverse function.
Step3: Plot the points of the inverse function
Plot the points obtained from the previous step on the same coordinate - plane.
Step4: Draw the graph of the inverse function
Connect the plotted points to form the graph of the inverse function, making sure to follow the symmetry about the line (y = x).
Answer:
Graph the points obtained by swapping the (x) and (y) - coordinates of the points on the original function and connect them, maintaining symmetry about the line (y=x).