the graph of a function is shown on the coordinate plane below. identify the rate of change of the function.
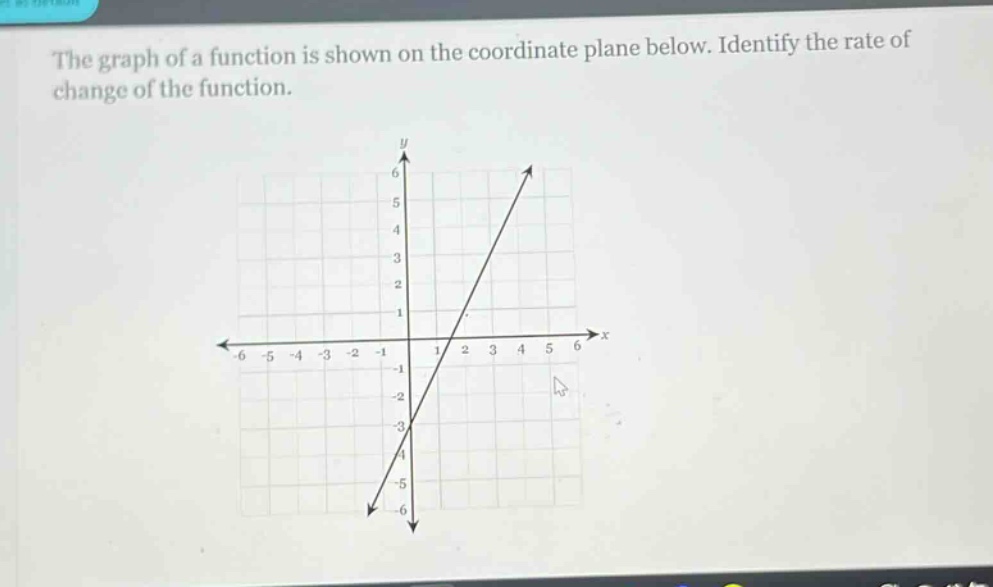
the graph of a function is shown on the coordinate plane below. identify the rate of change of the function.
Answer
Explanation:
Step1: Select two points
Let's take two points on the line, say $(0, - 3)$ and $(1,0)$.
Step2: Use slope - formula
The rate of change (slope $m$) of a line passing through two points $(x_1,y_1)$ and $(x_2,y_2)$ is given by $m=\frac{y_2 - y_1}{x_2 - x_1}$. Here, $x_1 = 0,y_1=-3,x_2 = 1,y_2 = 0$. So $m=\frac{0-(-3)}{1 - 0}=\frac{3}{1}=3$.
Answer:
3