the graph of the function f(x)=(x - 3)(x + 1) is shown. which describes all of the values for which the…
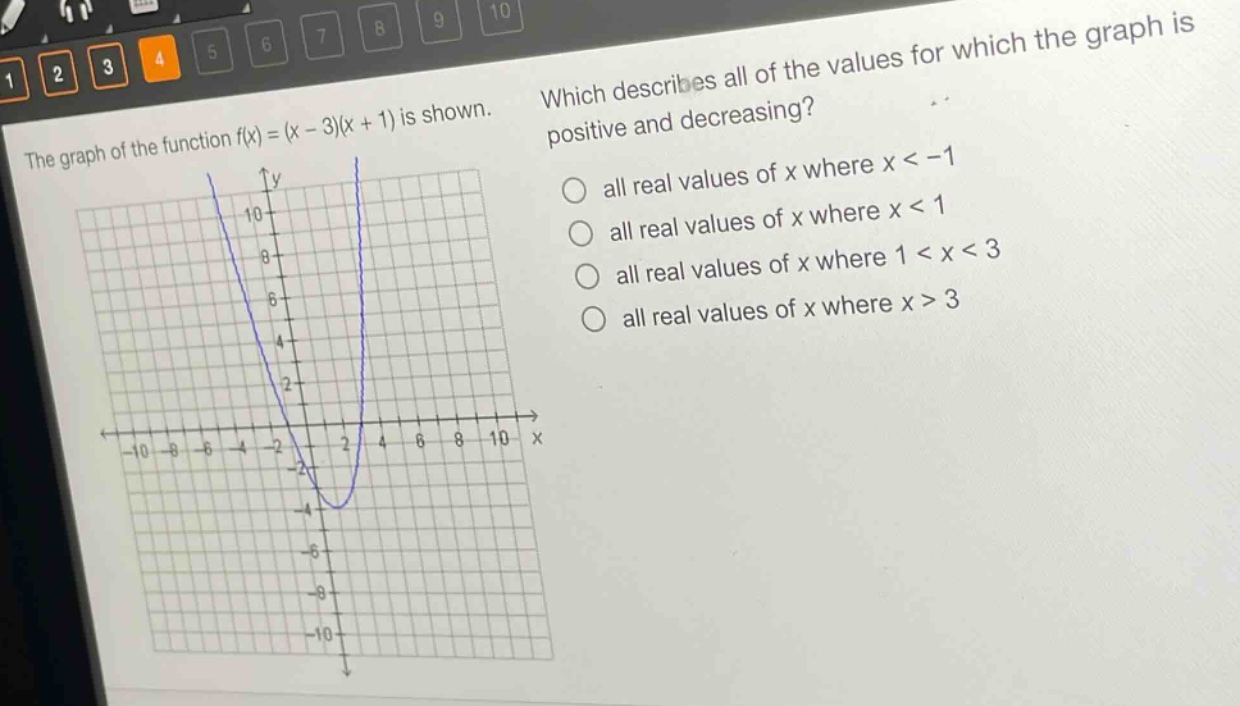
the graph of the function f(x)=(x - 3)(x + 1) is shown. which describes all of the values for which the graph is positive and decreasing? all real values of x where x < -1 all real values of x where x < 1 all real values of x where 1 < x < 3 all real values of x where x > 3
Answer
Answer:
A. all real values of x where x < -1
Explanation:
Step1: Find when the function is positive
The function (f(x)=(x - 3)(x + 1)) is a quadratic function. Its roots are (x = 3) and (x=-1). The function is positive when (x<-1) or (x > 3) since ((x - 3)(x + 1)>0) in those intervals.
Step2: Determine when the function is decreasing
For a quadratic function (y = ax^{2}+bx + c) (here (y=x^{2}-2x - 3), (a = 1), (b=-2), (c=-3)), the axis of symmetry is (x=-\frac{b}{2a}=-\frac{-2}{2\times1}=1). The function is decreasing for (x<1) when (a>0).
Step3: Find the intersection
The intersection of the intervals where the function is positive ((x<-1) or (x > 3)) and decreasing ((x<1)) is (x<-1).