the graph of a function g is shown below. find g(2).
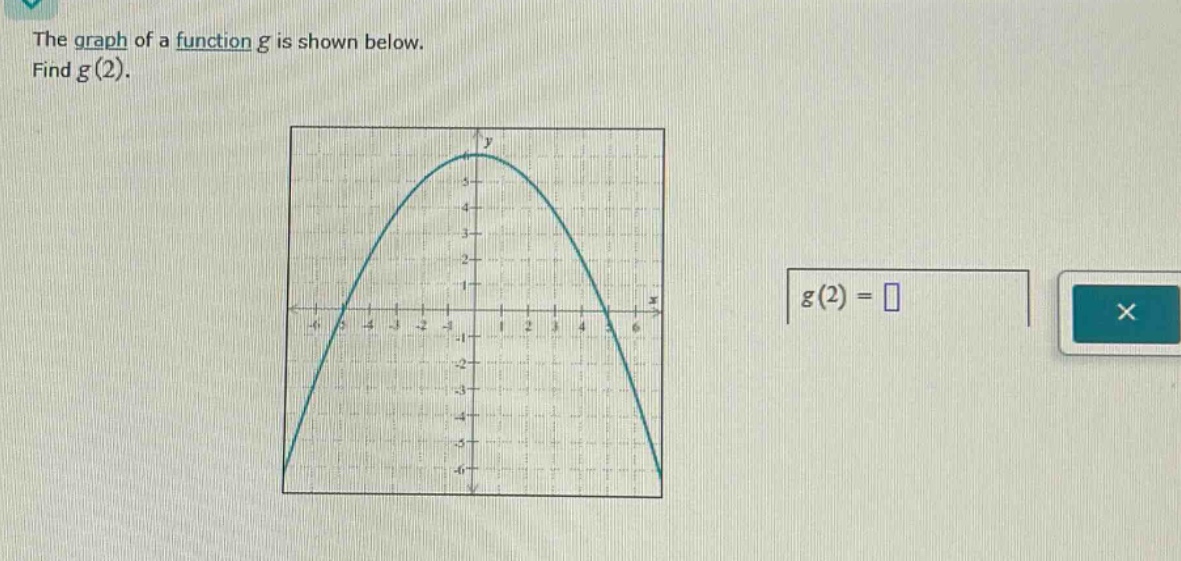
the graph of a function g is shown below. find g(2).
Answer
Explanation:
Step1: Locate x - value on graph
Locate $x = 2$ on the x - axis.
Step2: Find corresponding y - value
Find the y - value on the graph of $y = g(x)$ at $x = 2$. By observing the graph, when $x = 2$, the y - value is 5.
Answer:
5