the graph of y = f(x) is graphed below. what is the end - behavior of f(x)?
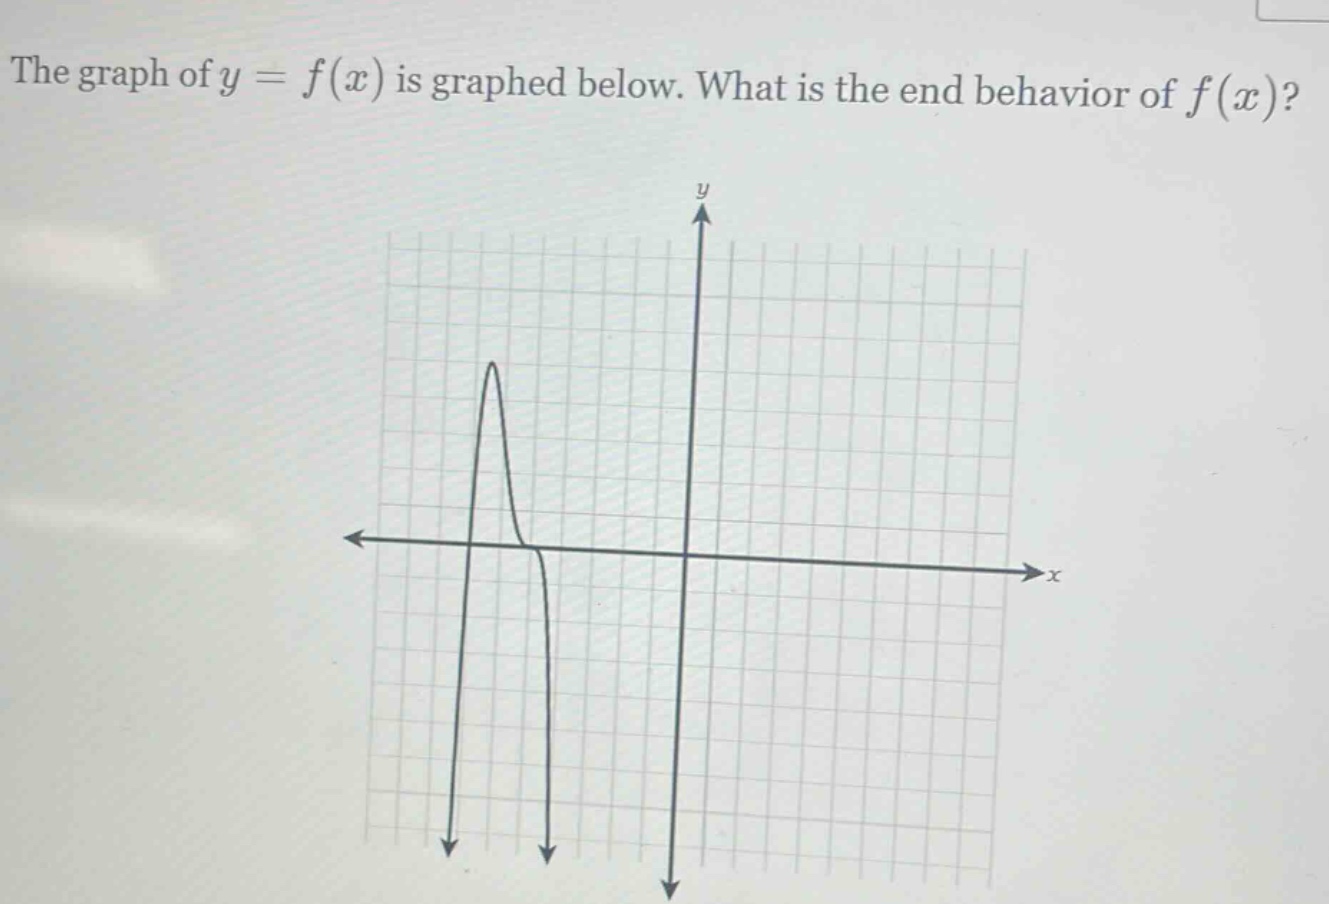
the graph of y = f(x) is graphed below. what is the end - behavior of f(x)?
Answer
Explanation:
Step1: Observe left - hand side
As $x\to-\infty$, the graph is going down. So, $\lim_{x\to-\infty}f(x)=-\infty$.
Step2: Observe right - hand side
As $x\to+\infty$, the graph is going down. So, $\lim_{x\to+\infty}f(x)=-\infty$.
Answer:
As $x\to-\infty$, $f(x)\to-\infty$; as $x\to+\infty$, $f(x)\to-\infty$