graph this inequality: y ≥ -3 plot points on the boundary line. select the line to switch between solid and…
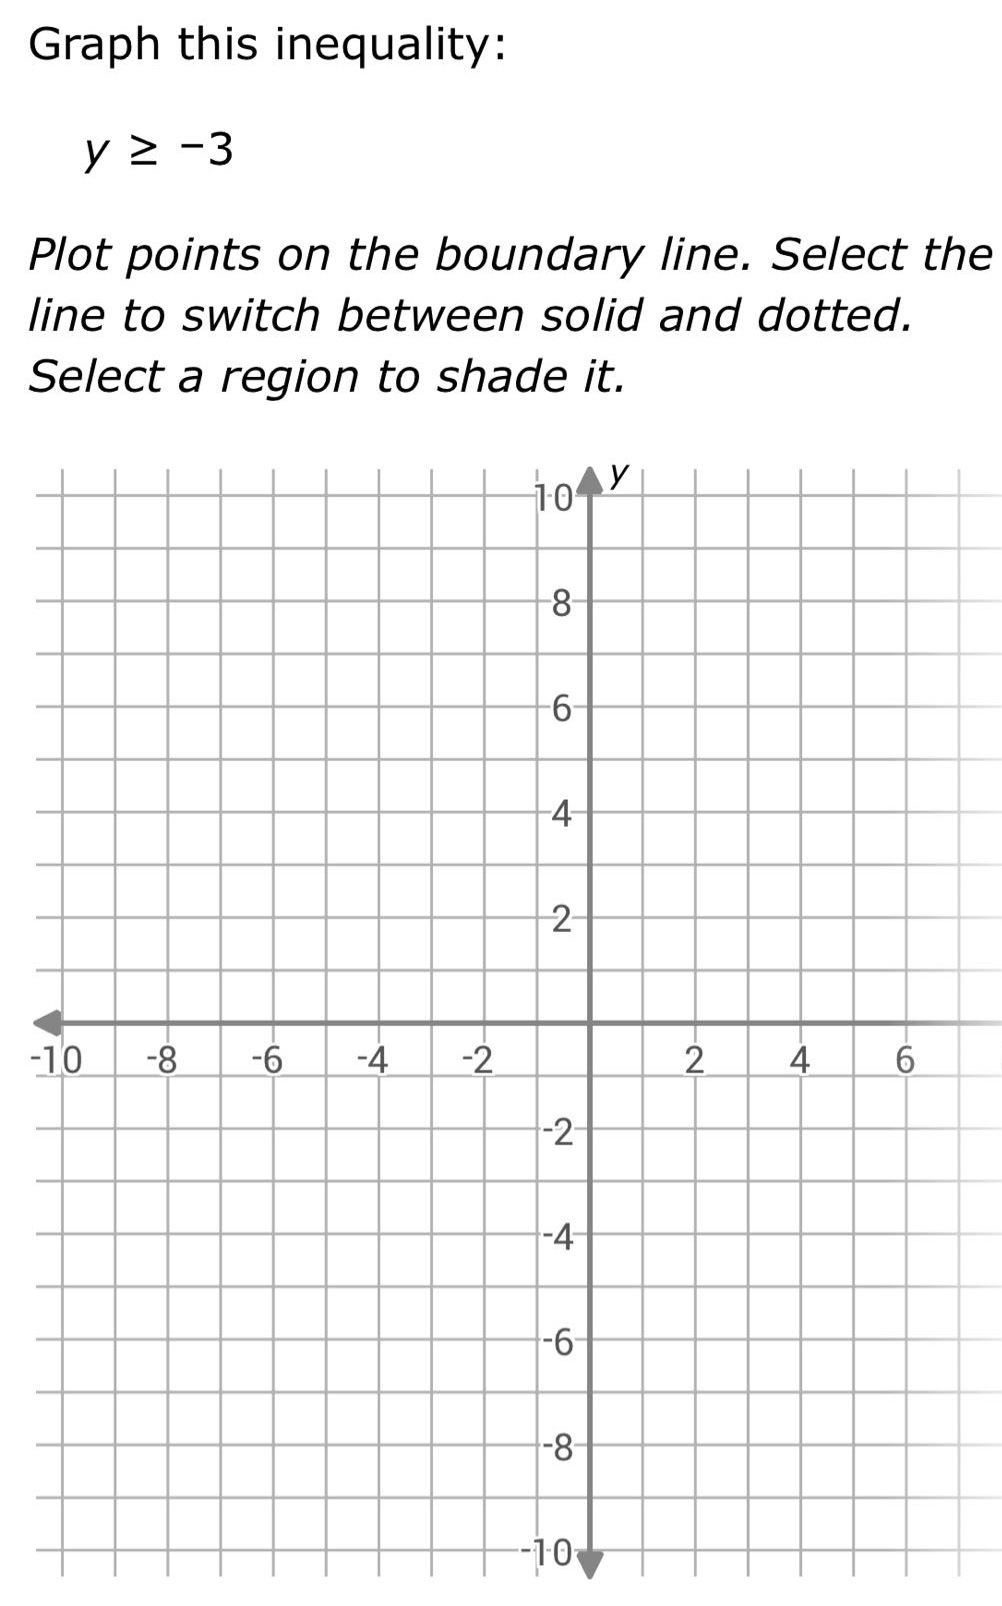
graph this inequality: y ≥ -3 plot points on the boundary line. select the line to switch between solid and dotted. select a region to shade it.
Answer
Explanation:
Step1: Identify the boundary - line equation
The boundary - line equation for $y\geq - 3$ is $y=-3$. It is a horizontal line.
Step2: Determine the type of the boundary line
Since the inequality is $y\geq - 3$ (the symbol is $\geq$), the boundary line is solid.
Step3: Find points on the boundary line
The equation of the line is $y = - 3$. Points on this line can be $(-5,-3),(0,-3),(5,-3)$ etc.
Step4: Determine the shaded region
For the inequality $y\geq - 3$, we shade the region above the line $y = - 3$ because we want all the $y$ - values that are greater than or equal to - 3.
To graph:
- Plot several points on the line $y=-3$ such as $(-5,-3),(0,-3),(5,-3)$.
- Draw a solid horizontal line passing through these points.
- Shade the region above the line $y = - 3$.
Answer:
Graph a solid horizontal line at $y=-3$ and shade the region above the line.