which graph most likely shows a system of equations with two solutions?
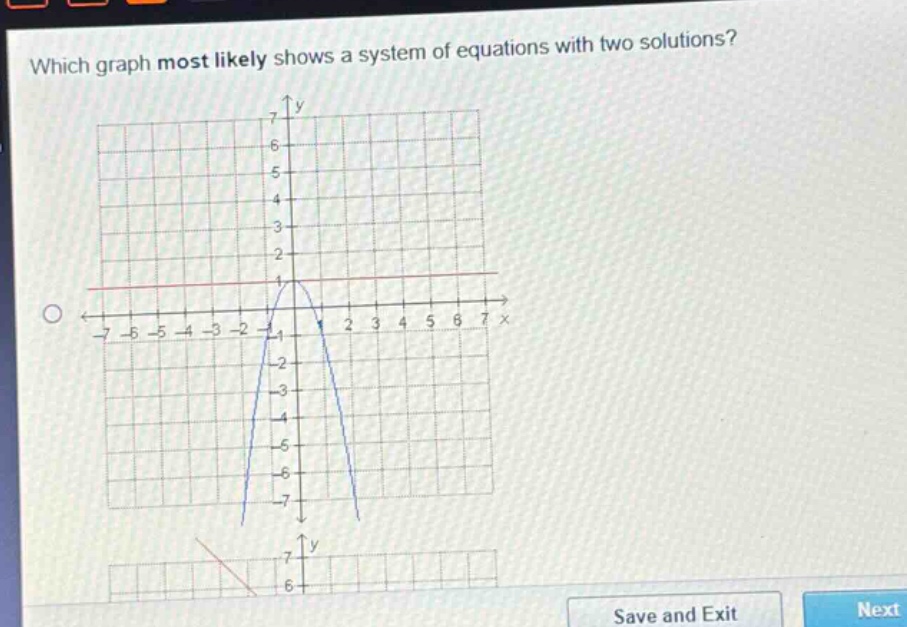
which graph most likely shows a system of equations with two solutions?
Answer
Explanation:
Step1: Recall solution concept
The solutions of a system of equations are the intersection - points of the graphs of the equations.
Step2: Analyze given graph
In the provided graph, the red horizontal line and the blue parabola intersect at two points. Each intersection point represents a solution of the system of equations formed by the equations of these two curves.
Answer:
The given graph (the one with a horizontal line and a parabola intersecting at two points)