which is the graph of the linear inequality y ≥ -x - 3?
which is the graph of the linear inequality y ≥ -x - 3?
Answer
Explanation:
Step1: Identify the boundary - line equation
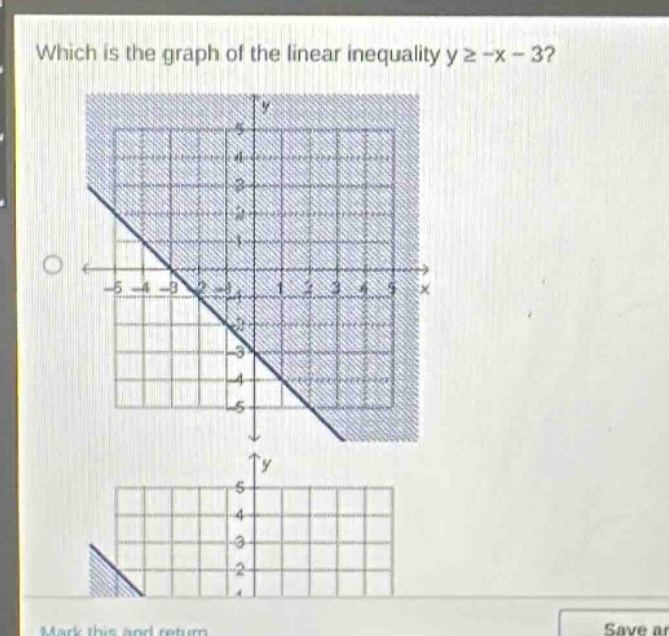
The boundary - line of the inequality (y\geq -x - 3) is the equation (y=-x - 3). The slope (m=-1) and the y - intercept (b = - 3).
Step2: Determine the type of the boundary - line
Since the inequality is (y\geq -x - 3) (the symbol is (\geq)), the boundary - line is a solid line.
Step3: Test a point
We can test the point ((0,0)). Substitute (x = 0) and (y = 0) into the inequality (y\geq -x - 3). We get (0\geq-(0)-3), which simplifies to (0\geq - 3). This is a true statement. So, the region that contains the point ((0,0)) is the solution region.
The graph of the inequality (y\geq -x - 3) has a solid line (y=-x - 3) (with slope (-1) and y - intercept (-3)) and the region above and including the line is shaded.
Answer:
The graph with a solid line (y=-x - 3) and the region above the line (including the line itself) is shaded. Since no options are labeled, based on the above - described characteristics, the graph with a solid line passing through ((0,-3)) and ((-3,0)) and the region above the line shaded is the correct one.