which is the graph of linear inequality 2y>x - 2?
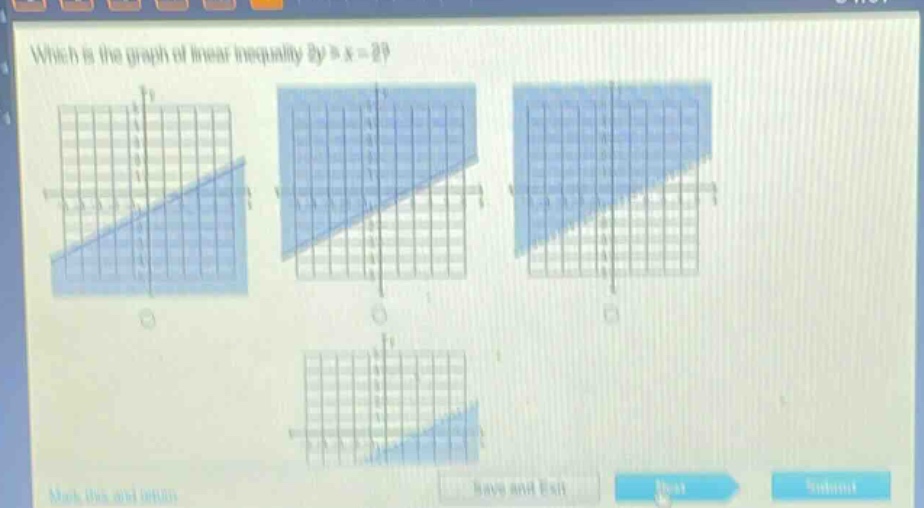
which is the graph of linear inequality 2y>x - 2?
Answer
Explanation:
Step1: Rewrite the inequality
First, rewrite (2y>x - 2) as (y>\frac{1}{2}x - 1).
Step2: Analyze the boundary - line
The boundary - line of the inequality (y>\frac{1}{2}x - 1) is the equation (y = \frac{1}{2}x - 1). The slope of the line is (\frac{1}{2}) and the y - intercept is (-1). Since the inequality is (y>\frac{1}{2}x - 1) (not (y\geq\frac{1}{2}x - 1)), the boundary - line should be a dashed line.
Step3: Test a point
Choose a test point not on the line, say ((0,0)). Substitute (x = 0) and (y = 0) into the inequality (y>\frac{1}{2}x - 1). We get (0>\frac{1}{2}(0)-1), which is (0>-1) (a true statement). So, the region that contains the point ((0,0)) is the solution region of the inequality.
Answer:
The graph with a dashed line having a slope of (\frac{1}{2}) and y - intercept of (-1) and the region above the line (including the region that contains the origin ((0,0))) is the correct graph. Without specific labels for the options, it's not possible to give a letter - based answer, but the described graph is the solution.